Contents
On the last evening of October I opened Polymarket to look at one number. The US midterm elections were three days away, and the market on which party would control the Senate had taken $13.5 million of bets.
A share that pays a dollar if Democrats win the Senate cost 71.5 cents. The House was hardly a contest by the market’s account: 94.5 cents for Democrats.
A week earlier the same kind of number had been wrong in public. Going into Brazil’s presidential runoff on 25 October, Polymarket and Kalshi gave Flávio Bolsonaro about an 80% chance of beating Lula, and Lula won[1]. Semafor’s headline that week was that prediction markets had “blown three big elections”[2].
By the time you read this you probably know how the Senate went, and I don’t. Suppose Republicans keep it. Was 71.5 wrong?
Suppose they lose it. Was it right? Neither follows, and Brazil does not prove the 80% wrong either.
A forecast of 71.5% claims something only about many situations like this one: that roughly seven in ten of them end the way the market leaned, and three in ten don’t.
So the question in the title cannot be settled by any one market, however famous. It can be settled by many. I downloaded the record of every market Polymarket resolved from 2024 on, almost three million of them, took the price histories of about 150,000 and checked what the prices said against what then happened.
This post is about what came out: how good the prices are as probabilities, where they are systematically off, a trap in the most natural way to slice the data, what the “accuracy” figures in the press leave out, and what a trader can and cannot do with any of it.
What a price on Polymarket is
Polymarket sells shares in outcomes. A share of “Yes” pays one dollar if the event happens and nothing if it does not; a share of “No” pays a dollar in the opposite case.
Since April 2026 the dollar is pUSD, Polymarket’s own token backed by the USDC stablecoin; before that it was USDC itself[3]. One Yes and one No together always pay exactly a dollar, so their prices add up to about a dollar too.
Every market is binary. A question with many answers, such as who wins a prize, is a set of Yes/No markets, one per candidate.
Shares trade in an order book, as on a stock exchange: buyers post bids, sellers post asks, and a trade happens when they meet.
The price the site shows, the number the press calls “the odds”, is the midpoint between the best bid and the best ask, or the last trade if the gap between them is wider than ten cents[4].
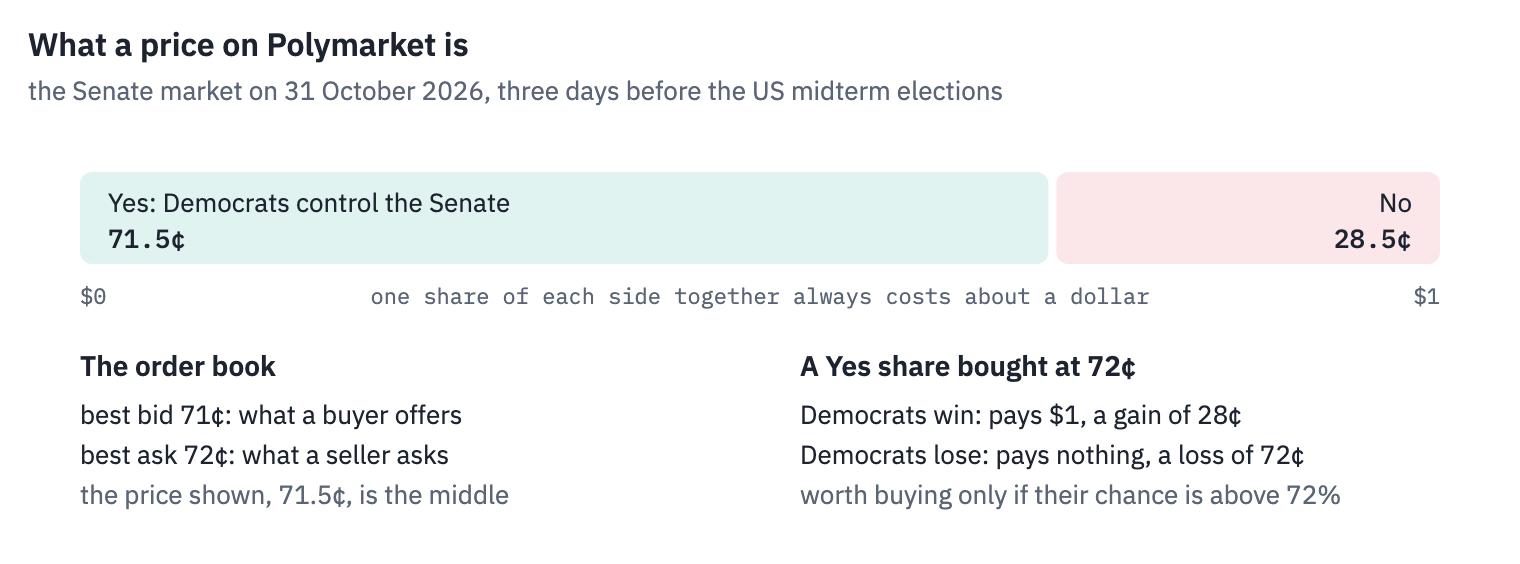
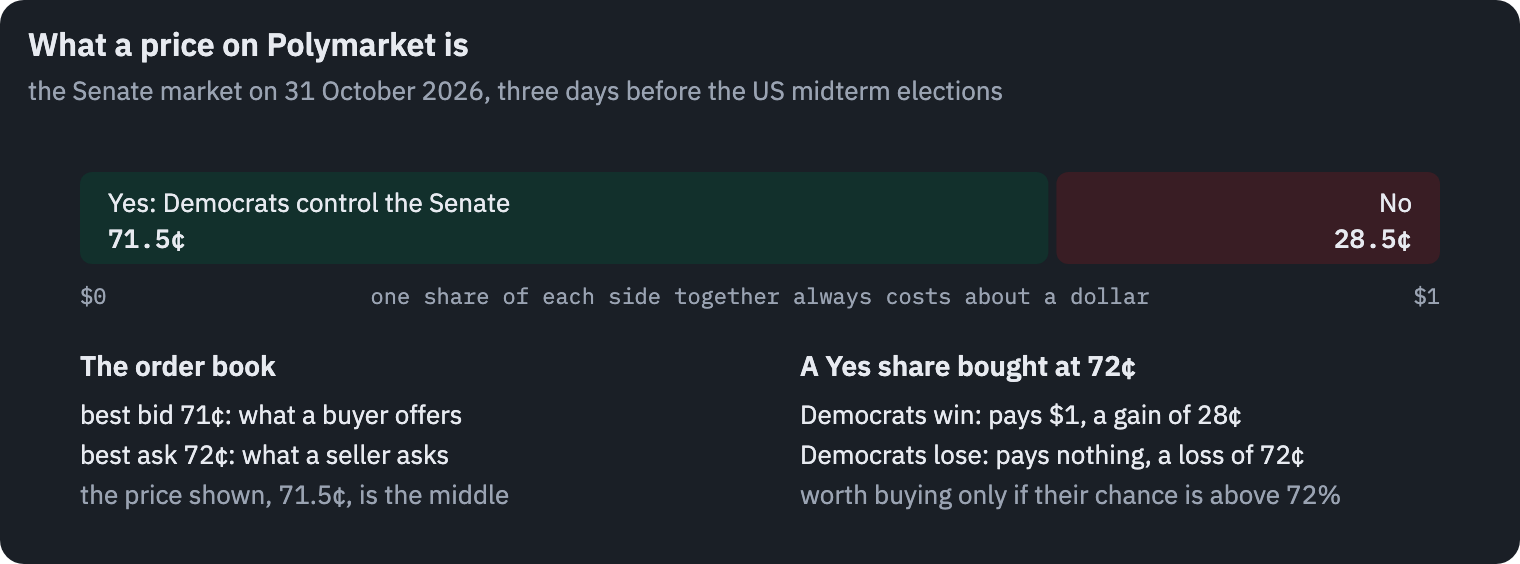
Why should that price be a probability? Because of a simple argument about money. If you believe Democrats win the Senate with probability \(q\), a Yes share bought at price \(p\) is worth \(q \cdot 1 + (1 - q) \cdot 0 = q\) to you on average.
You buy when \(q > p\) and sell when \(q < p\). The price stops moving where nobody with money left is willing to push it either way.
That argument has holes, and economists have spent twenty years mapping them. The price is a compromise between traders, not anyone’s belief.
With logarithmic utility it equals the traders’ average belief, and for other reasonable preferences it stays close to it between about 20 and 80 cents[5]; for risk-neutral traders with different beliefs, a price of 75 cents is compatible with an average belief anywhere from 56% to 94%[6].
Money tied up in a bet until December could have earned interest. Since March 2026 most categories charge the taker a fee[7]. And the dollar arrives only if the event is resolved the way you expect, by a process with its own failures.
Whether the price works as a probability despite all that is an empirical question, and the rest of this post answers it with data.
How to check a forecaster
A forecaster who said 70% is not wrong when the event fails to happen, but a forecaster who says 70% a thousand times should see about seven hundred of those events happen. That property is called calibration.
Weather services have been checked this way for seventy years: on the days a calibrated service gives a 30% chance of rain, it rains on about 30% of them.
The picture that shows calibration is the reliability diagram. Take all the forecasts, group them by value (all forecasts between 60% and 70%, say), and for each group plot the average forecast against the share of events that happened. A calibrated forecaster’s points fall on the diagonal.
If you have ever trained a classifier and checked whether its predicted probabilities can be trusted, you have drawn this picture already; modern neural networks are famously overconfident on it[8], and how to bin the forecasts is a small science of its own[9].
Calibration is not enough. A forecaster who always announces the base rate, the share of all events that happen, is perfectly calibrated and perfectly useless. About 34% of Polymarket’s markets resolve Yes, so saying “34%” about every market is calibrated: of all the markets you said it about, 34% happened.
What a good forecaster adds is resolution, forecasts that move away from the base rate in the right direction, high for the events that happen and low for those that don’t.
The Brier score measures both at once. For \(N\) forecasts \(p_i\) of events with outcomes \(y_i\) (1 if it happened, 0 if not), it is the mean squared error
\[\mathrm{BS} = \frac{1}{N} \sum_{i=1}^{N} (p_i - y_i)^2 .\]A forecast of 70% scores \(0.3^2 = 0.09\) if the event happens and \(0.7^2 = 0.49\) if it does not. A forecaster who always says 50% scores \(0.25\), and a clairvoyant scores zero. Glenn Brier’s original score summed the error over both outcomes and ran from 0 to 2, so it is twice this one[10].
Allan Murphy showed that the score splits into three parts[11]. Group the forecasts into bins \(k\), each holding a share \(n_k / N\) of them, with average forecast \(\bar p_k\) and observed frequency \(\bar y_k\), and let \(\bar y\) be the overall base rate:
\[\mathrm{BS} \approx \underbrace{\sum_k \frac{n_k}{N} (\bar p_k - \bar y_k)^2}_{\text{reliability}} \;-\; \underbrace{\sum_k \frac{n_k}{N} (\bar y_k - \bar y)^2}_{\text{resolution}} \;+\; \underbrace{\bar y (1 - \bar y)}_{\text{uncertainty}} .\]Reliability is the calibration error, the squared distance of the points from the diagonal, and should be small. Resolution is how far the groups’ outcomes spread away from the base rate, and should be large.
Uncertainty belongs to the questions, not the forecaster: it is the score of the base-rate forecaster. The skill score \(1 - \mathrm{BS} / \bar y(1 - \bar y)\) says what share of that score a forecaster removes.
The three charts below put this on real data. All three forecasters see the same 18,157 markets a week before they closed. The first is Polymarket’s prices.
The second is a bolder copy that doubles the prices’ log-odds, so that 70% becomes 84% and 30% becomes 16%. The third is a timid copy that halves them, so that 70% becomes 60%. The grey square is the base-rate forecaster.
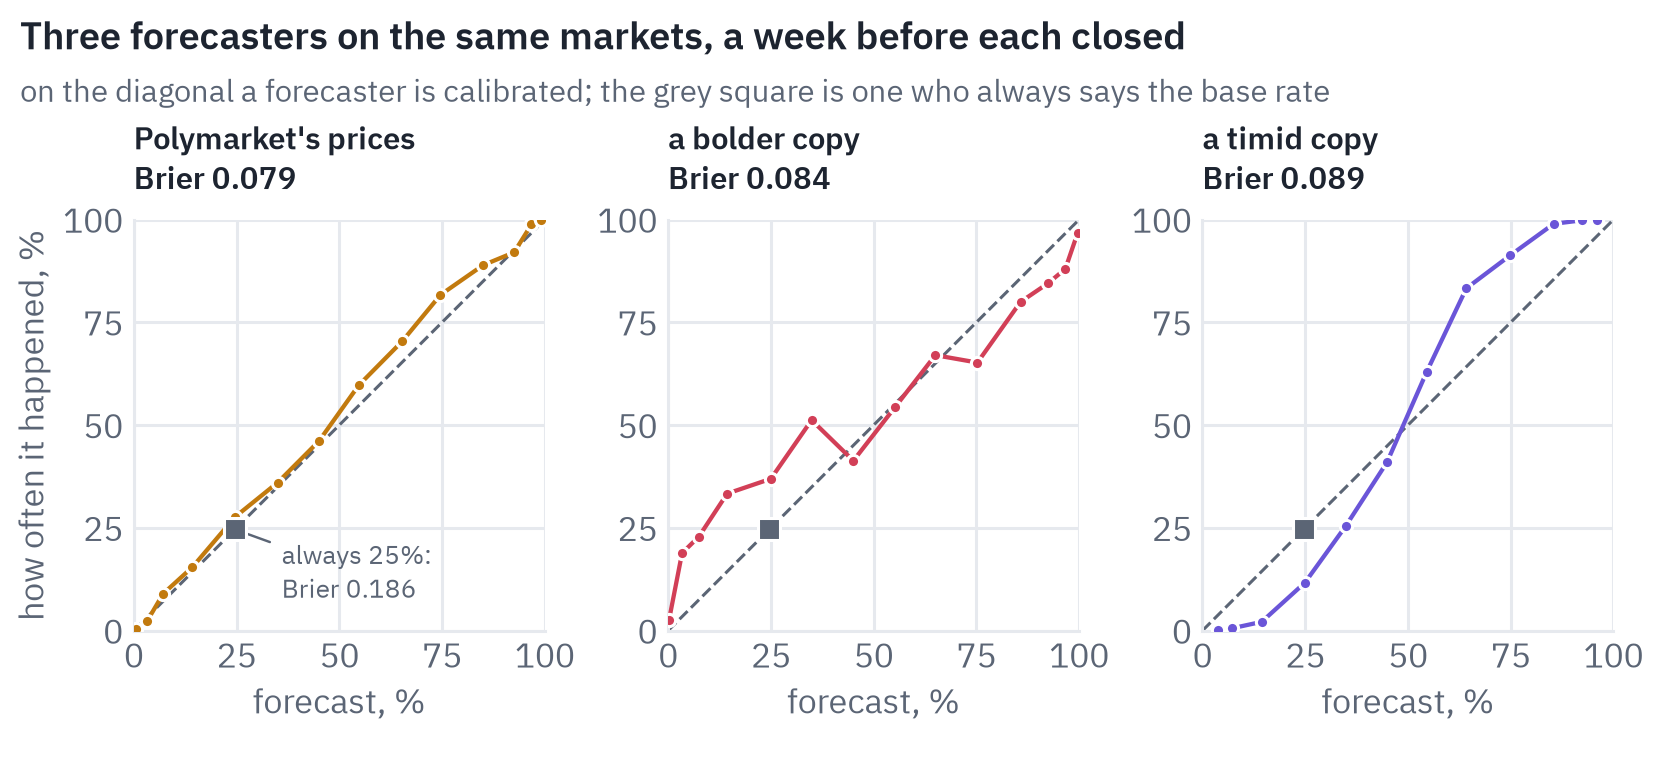
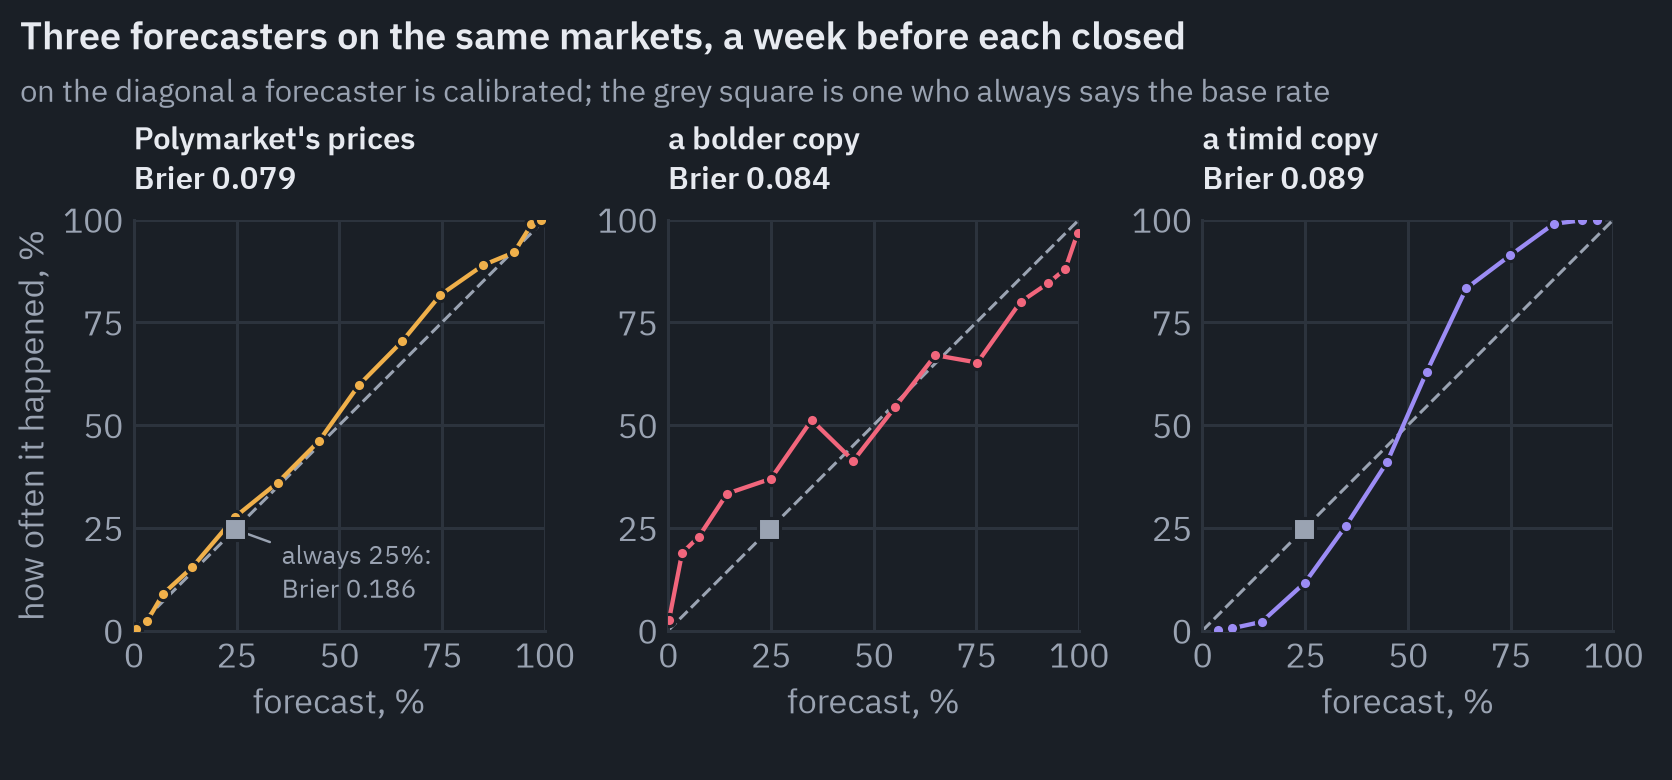
The market’s own prices score 0.079. Both copies score worse, 0.084 for the bold one and 0.089 for the timid one, and they fail in opposite ways.
The bold copy’s points lie above the diagonal on the left and below it on the right: when it says 5%, the event happens more often than that, because it took a modest forecast and inflated its confidence.
The timid copy bends the other way. Neither copy knows anything the market didn’t, and that is the point of the exercise: distorting a calibrated forecaster in either direction only makes its score worse.
The base-rate forecaster says 25% about everything, the share of these markets that resolved Yes, and scores 0.186, more than twice the market’s error.
One election proves nothing
The case people quote as proof is the 2024 US presidential election. On the eve of the vote Polymarket priced a Trump win at 59 cents, while 538’s final model gave Kamala Harris 50 chances in 100[12]. Trump won all seven swing states.
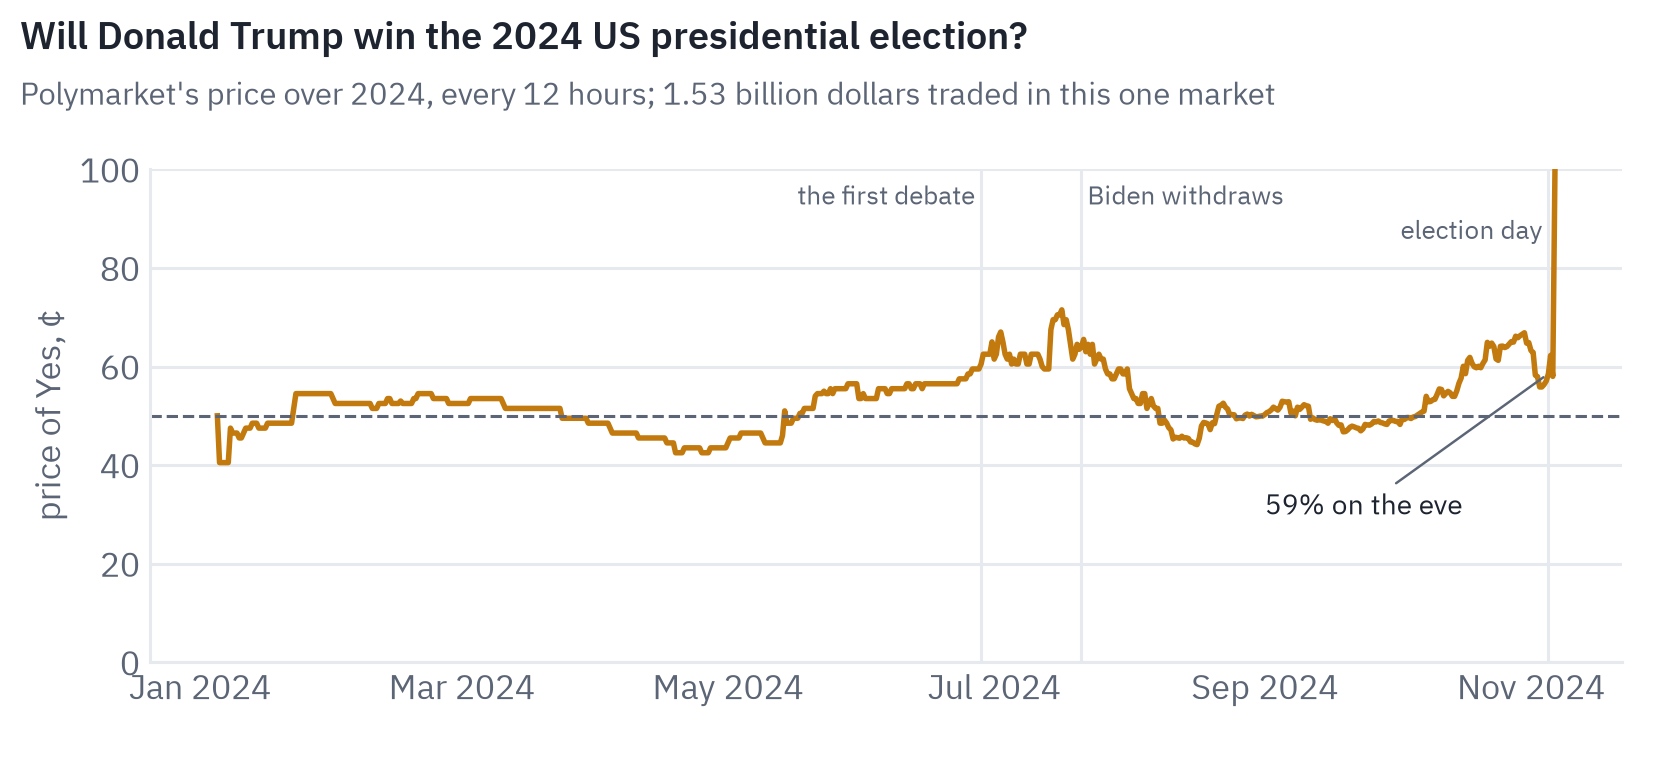
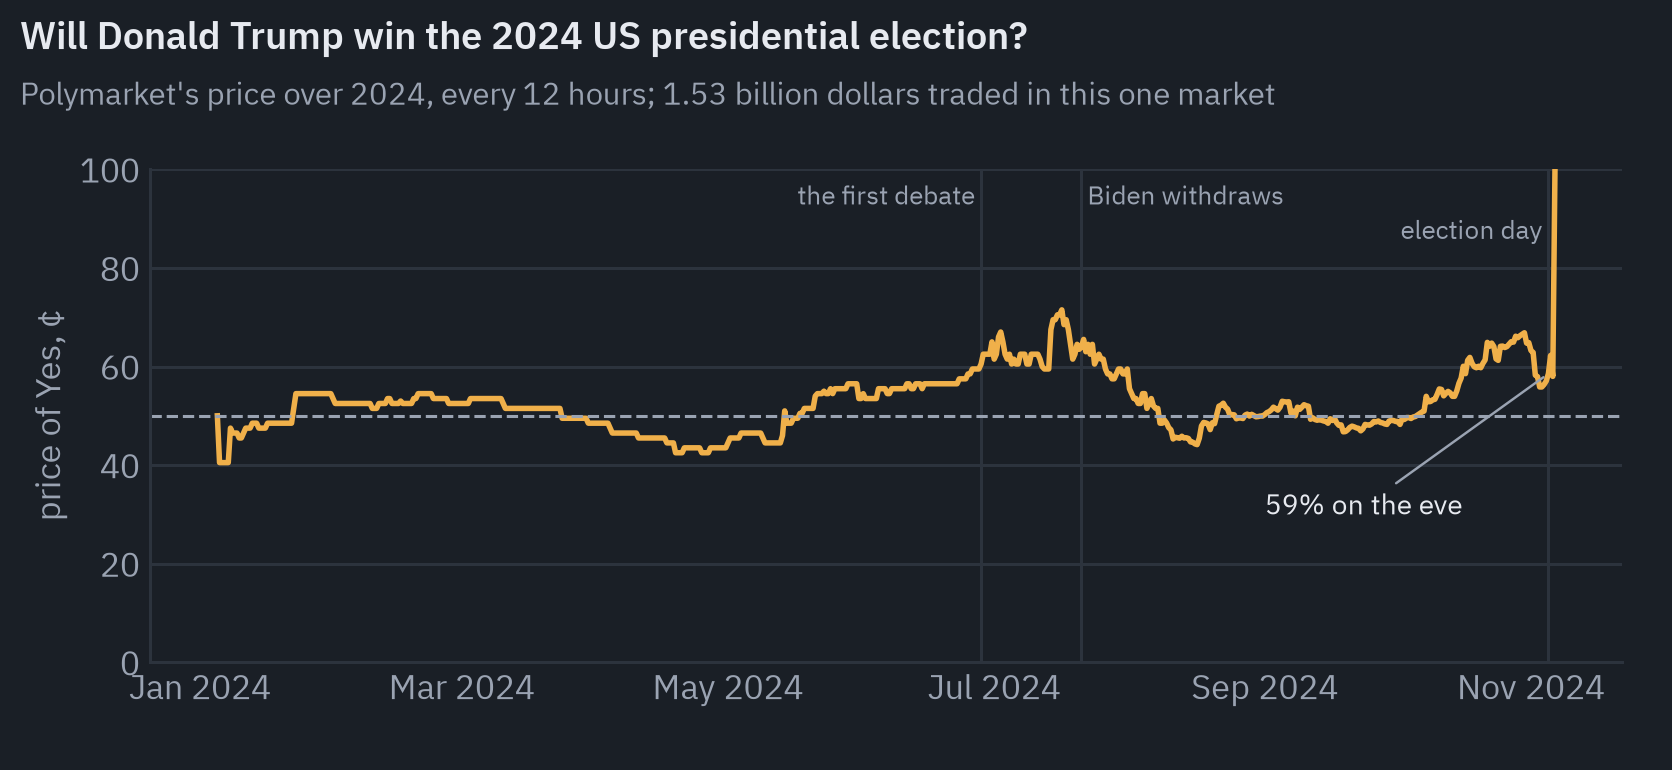
The market’s best-known trader that year, a Frenchman the press called Théo, had bet more than $30 million on Trump across several accounts.
He told the Wall Street Journal he had “absolutely no political agenda”[13], and later turned out to have commissioned his own polls, asking people not whom they would vote for but whom their neighbours would[14]. He made tens of millions of dollars, and he was right.
Think about what that shows. A forecaster who put 59% on the winner scores \(0.41^2 \approx 0.17\) for that election; one who put 50% scores \(0.25\).
A single draw from a coin that lands heads 59% of the time says almost nothing about the coin, and the same arithmetic run on Brazil a week ago says almost nothing in the other direction. One outcome cannot separate a good forecaster from a lucky one. Thousands can.
The data
Polymarket publishes everything needed to check it. Its Gamma API lists every event and market with its question, its tags, the dollars traded and the final outcome; its order-book API returns the price history of every outcome token.
I took every event that closed from 2024 to the end of October 2026 with at least $1,000 traded: 2,959,534 binary markets that resolved cleanly to Yes or No. (The API records only a few thousand markets before 2024, and I leave them out of the counts.)
About 0.4% of markets with more than $10,000 traded resolved 50-50, the platform’s answer to a question that turned out ambiguous, and I set those aside.
The first surprise is what the platform has become.
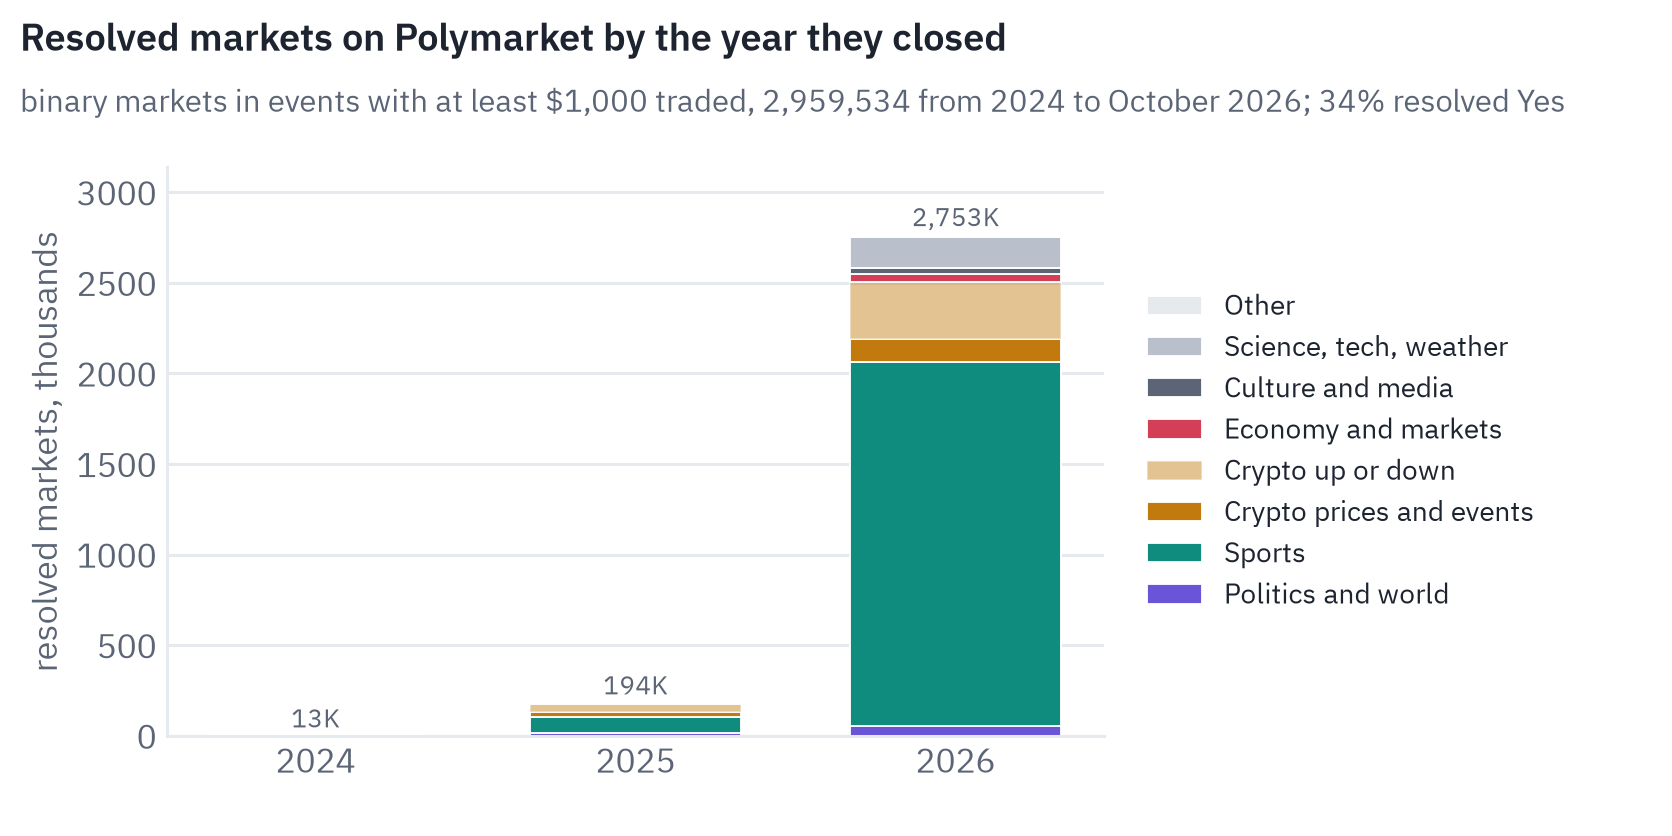
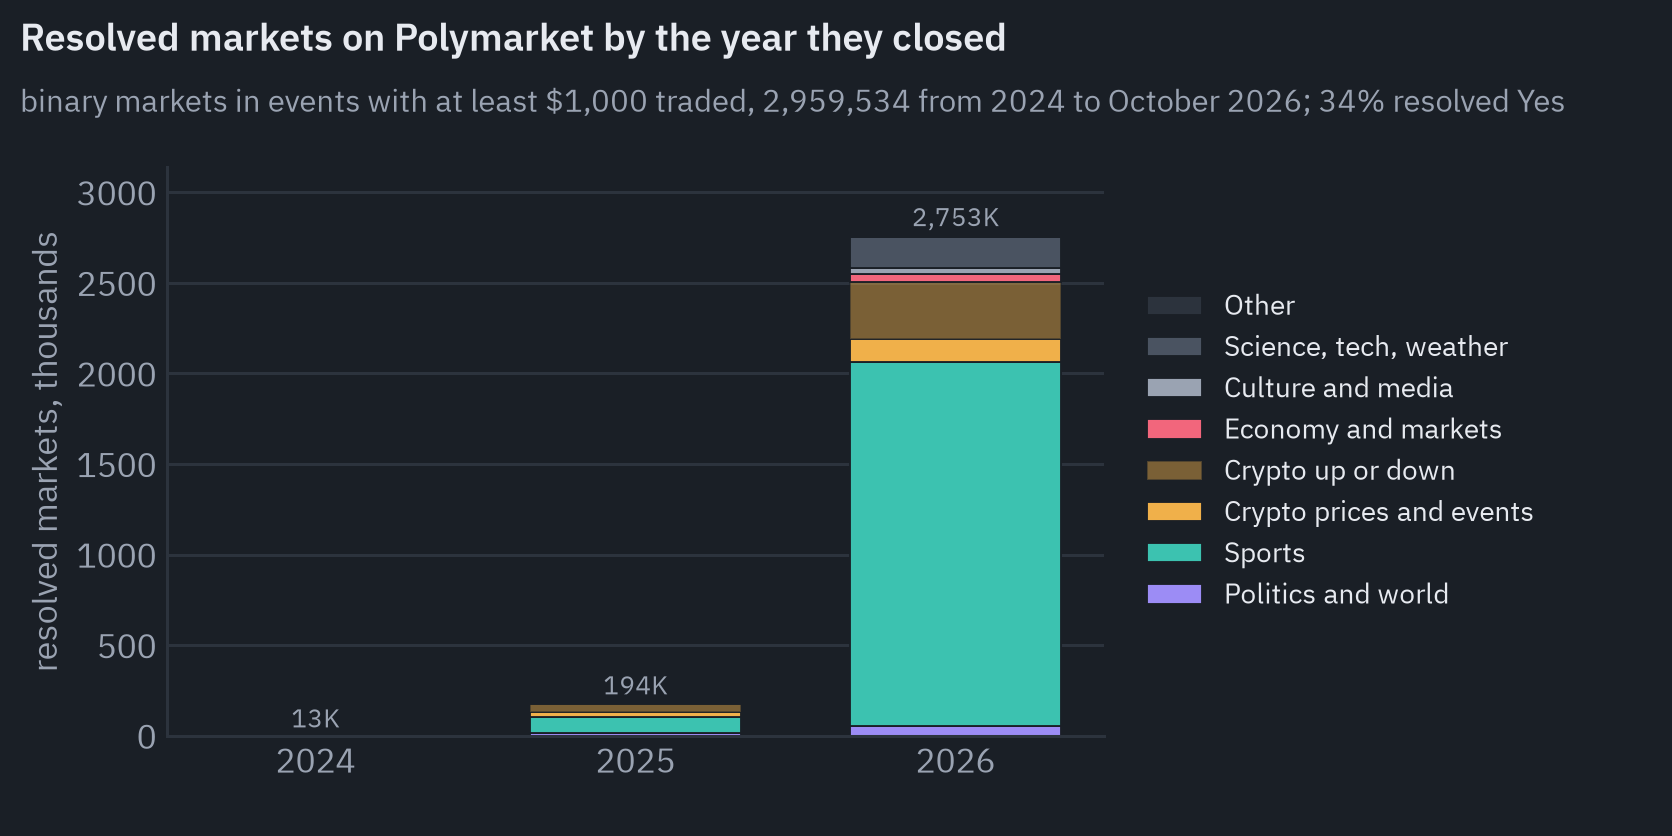
Polymarket in 2026 is mostly a sports book. One football match can carry a dozen markets (the winner, the handicap, the total goals), and sports make up 73% of all the markets that closed this year.
Next come the short crypto markets that ask whether Bitcoin will be higher at the end of the next fifteen minutes, hour or day, 11%, and science and weather questions, 6%. Politics, the subject of nearly every article about prediction markets, is 2% of the count.
Downloading the price history of three million markets is not practical, so I sampled, and how to sample turned out to matter more than anything else in this study. I made two independent random draws.
The first takes a share of the markets in each topic, whatever their size: 1.7% of sports, 11% of politics, 16% of economics, 20% of culture, 5.5% of crypto, 3.5% of science and weather.
The second takes every market with more than $100,000 traded (every sports market with more than a million) and a share of the smaller ones above $10,000. Together they hold 153,602 markets in 80,320 events.
Every market had a known chance of being drawn, and when I pool markets each counts in inverse proportion to that chance, so the pooled figures describe all resolved markets rather than my sample; statisticians call this the Horvitz–Thompson estimator[15].
Drawing big markets more often is harmless as long as the weights undo it. Leaving markets out, or grouping them by size, is not, as a later section shows. Uncertainty comes from a bootstrap over events rather than markets, because the twenty candidates of one election are not twenty independent questions.
The forecast I score is the price of a market’s first outcome (Yes, in a Yes/No market) a fixed time before the market closed: a week, mostly, and a day, a month or three months where I compare horizons.
The close comes after the outcome is known, typically hours after a match ends or a day or two after an election, so a week before the close is before the event itself.
A market counts as a forecast only if at least $1,000 had been traded in it in the week before. This matters more than it sounds. Most markets on Polymarket are created, barely traded and resolved, and the price history of such a market is the middle of an almost empty order book.
One football market in my sample, on whether a Bundesliga match would have five goals or more, stood at 48 cents a week before the game; most matches end with fewer, this one did too, and over its whole life the market traded $134. That price is not a forecast of a high-scoring game.
A bid at one cent and an ask at 95 cents would give it. The test uses only what was known at the time, the trades of that week, which I took from Polymarket’s public trades API.
Calibration
Here is the main result.
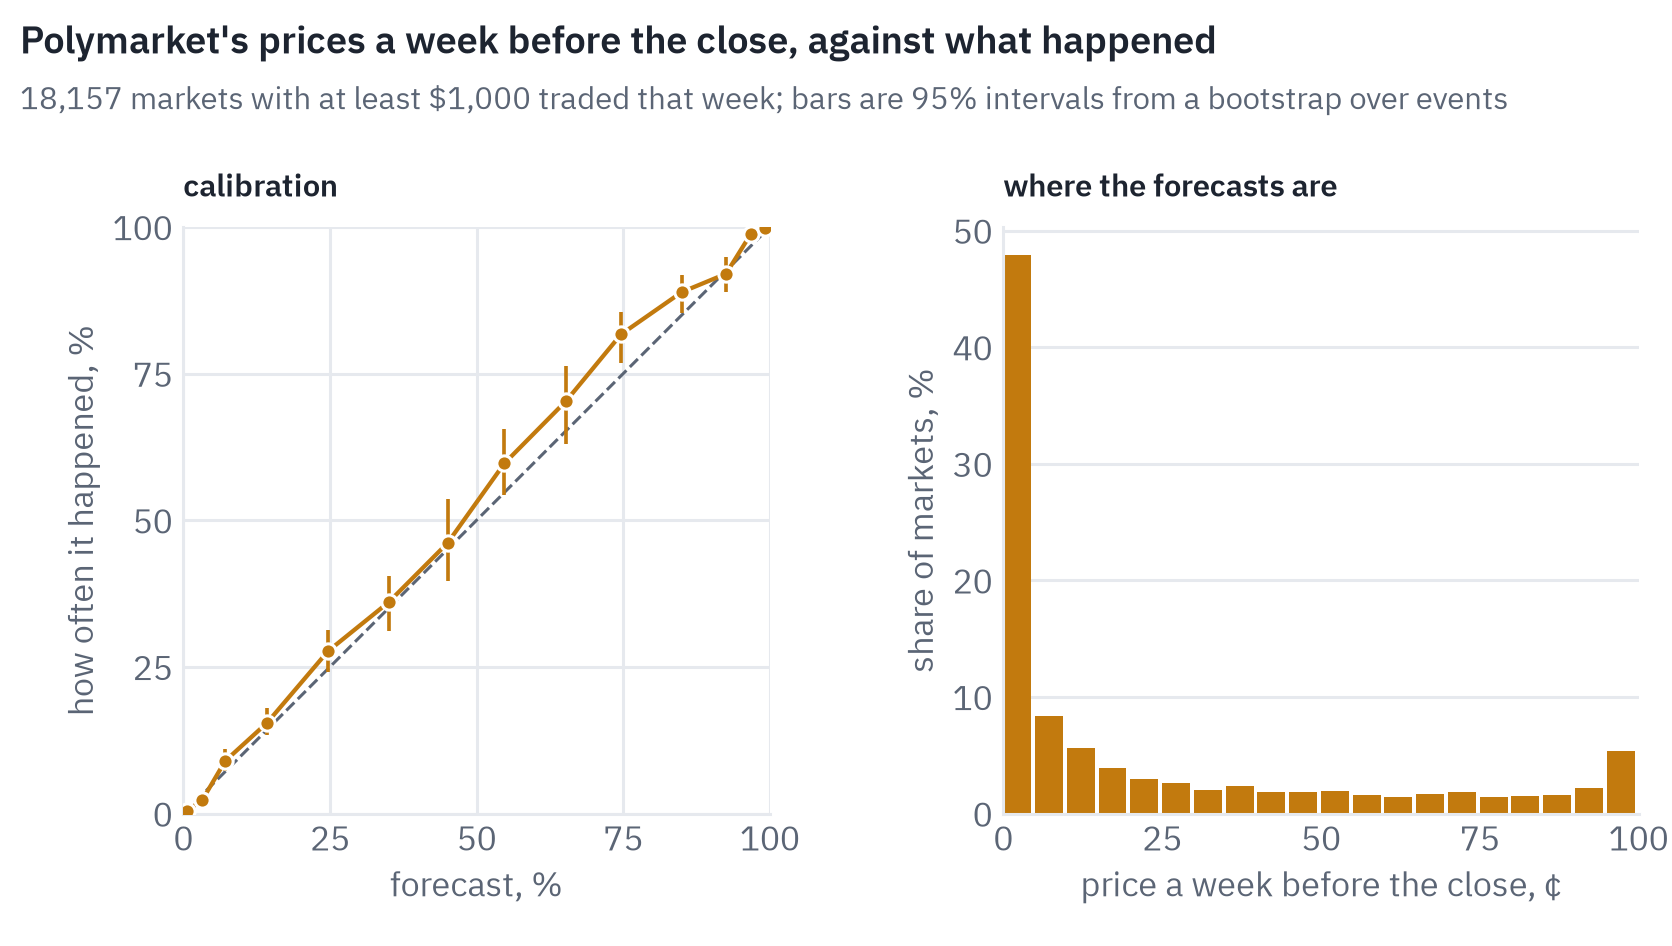
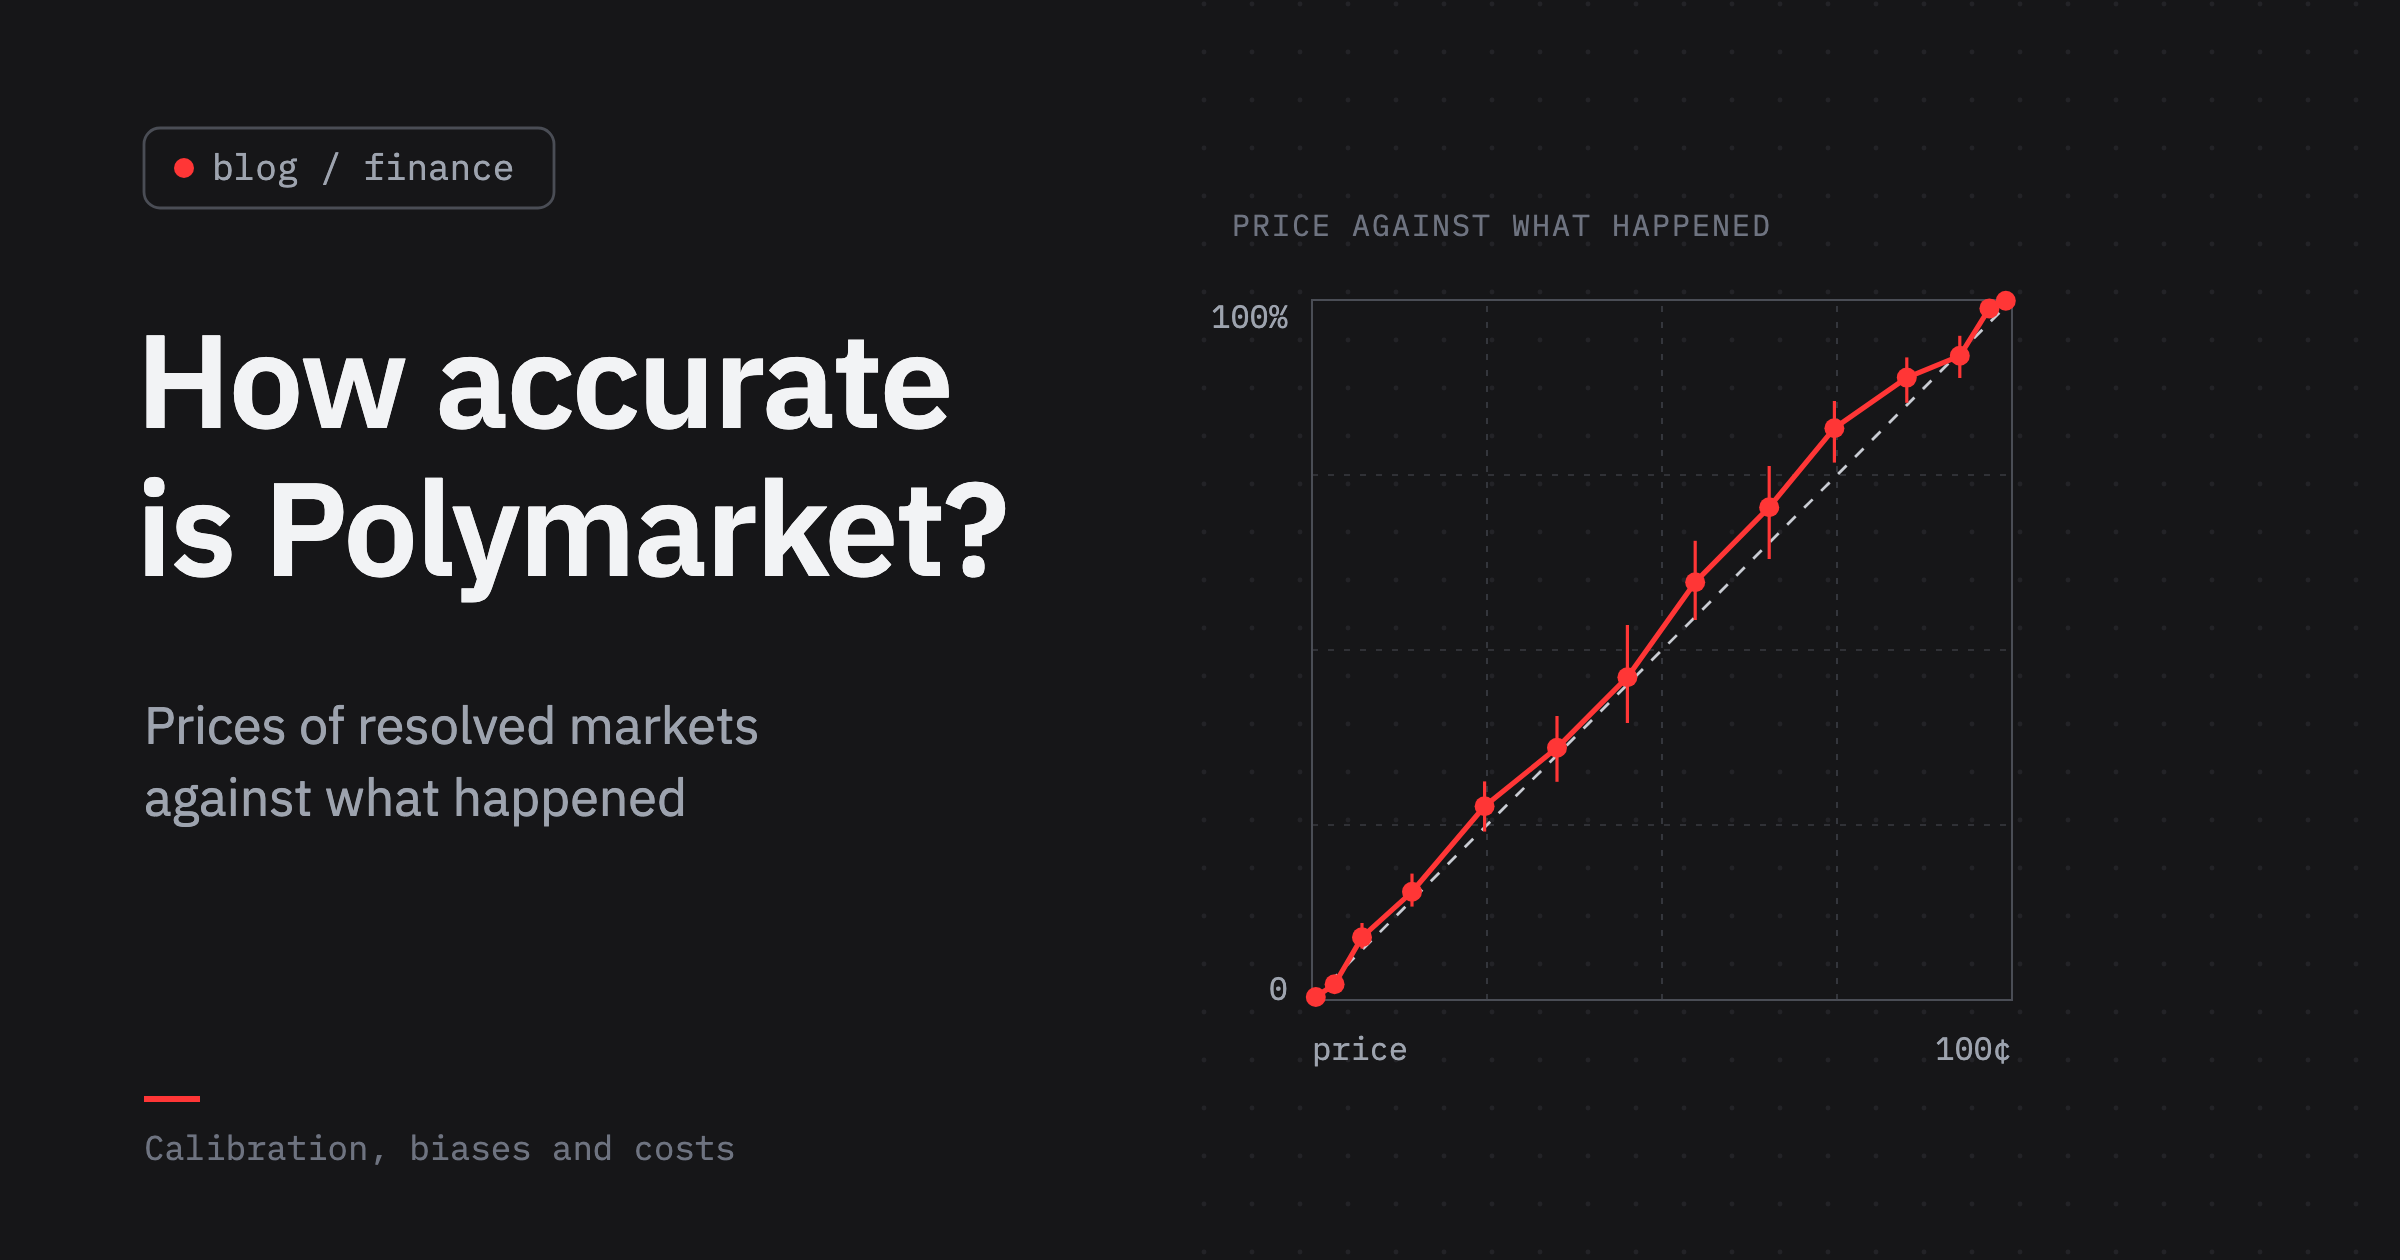
The points sit close to the diagonal. Of the 18,157 markets with real trading a week before the close, those priced around 25 cents resolved Yes 28% of the time and those around 75 cents 82%.
The average gap between price and frequency is 1.8 percentage points, and the reliability term of the Brier score is 0.001, a hundredth of the resolution term, 0.108. A weather service would be pleased with that.
The small deviations have a shape. Between 55 and 85 cents events happened a little more often than priced (60% of the markets at 55 cents, 82% of those at 75), while contracts at 2 to 5 cents happened less often than priced, 2.3% of the time against a price of 3.2. The prices are slightly compressed toward the middle: favourites a little too cheap, longshots a little too dear.
That is the pattern economic theory predicts for traders who like long shots or dislike tying up money, and it is what a Princeton thesis on 188,509 Polymarket markets found too[16].
The right panel shows something just as important: where the forecasts are. Almost half of these markets are priced below 5 cents a week before they close.
Most questions on Polymarket are of the form “will this specific thing happen”, most of them don’t happen, and the market knows. Those confident, correct and uninteresting forecasts are a large part of every headline accuracy figure.
Accuracy and the forecaster who always says no
Polymarket advertises its record on a page titled “How accurate is Polymarket?”: 98.7% accurate four hours before resolution, 90.3% a month before[17]. Accuracy there means the share of markets where the leading outcome won.
It sounds like a hard bar to clear. The same page notes that 78.3% of its markets resolve No, and explains why: “There are usually more ways for something not to happen than to happen in one exact way”.
A forecaster who answers “No” to every question without reading it is therefore 78% accurate on Polymarket’s own sample. The left half of the next chart shows what that does to the comparison on mine.
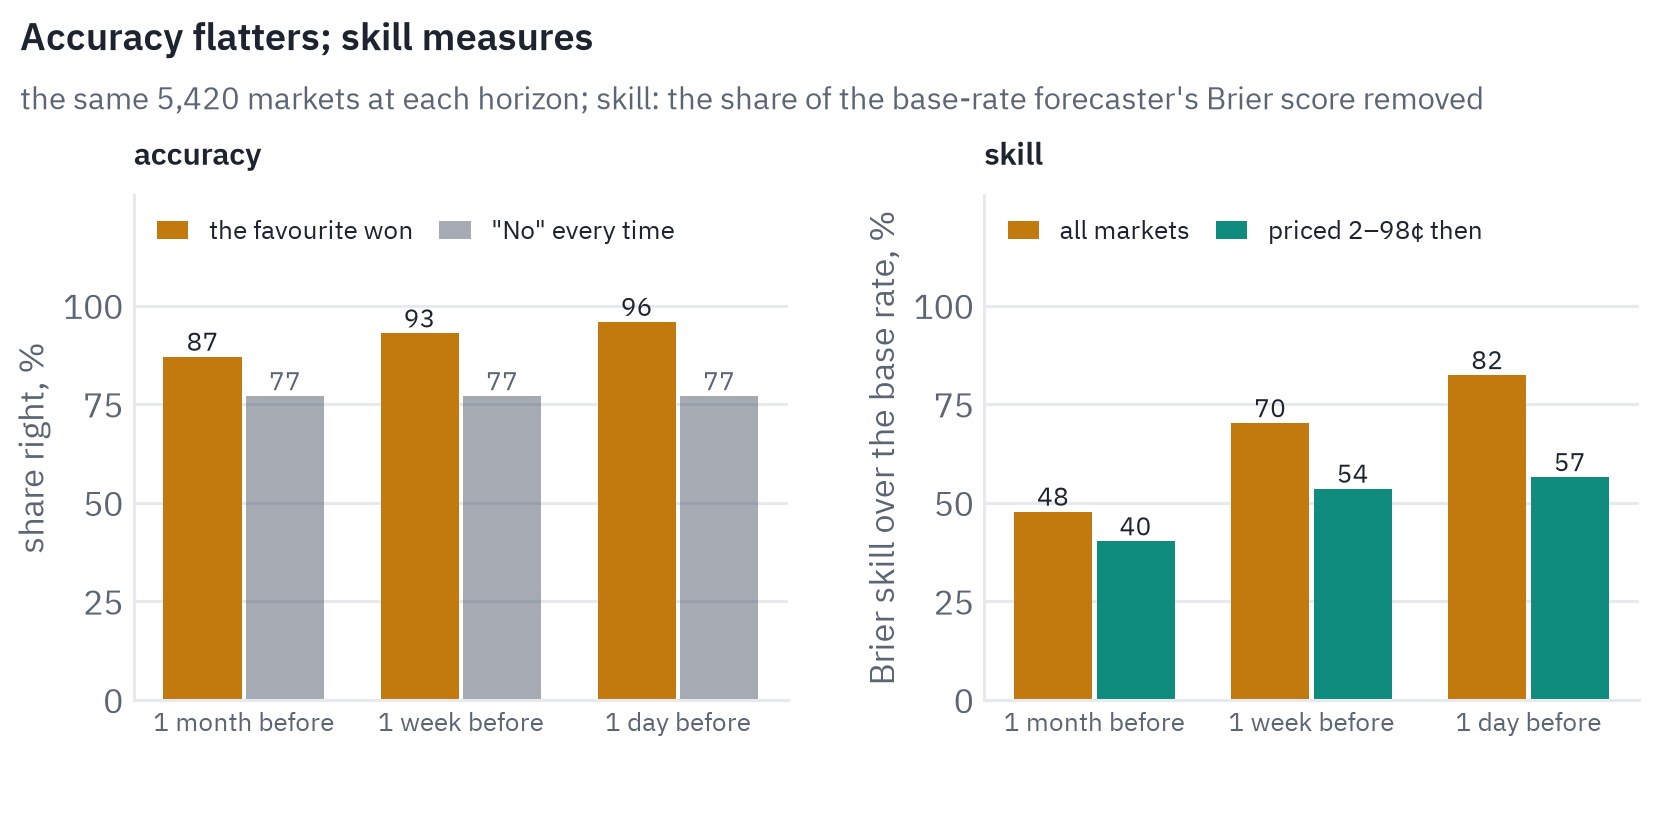
The chart uses the 5,420 markets that had real trading a month, a week and a day before they closed, so the same questions are scored at every horizon.
The favourite won 87% of them a month before the close, 93% a week before and 96% a day before. A forecaster who says No to everything gets 77% right on these markets at every horizon, since only 23% of them resolved Yes.
The honest comparison is skill: the market removes 48% of the base-rate forecaster’s Brier score a month out, 70% a week out and 82% a day out.
On the questions still in doubt at the time, priced between 2 and 98 cents, it removes 40%, 54% and 57%. Those are the numbers to keep in mind the next time anyone, a platform or a pundit, advertises 90% accuracy.
How the forecast sharpens
Information arrives over time. The Brier score of markets that lived at least two months traces how quickly.
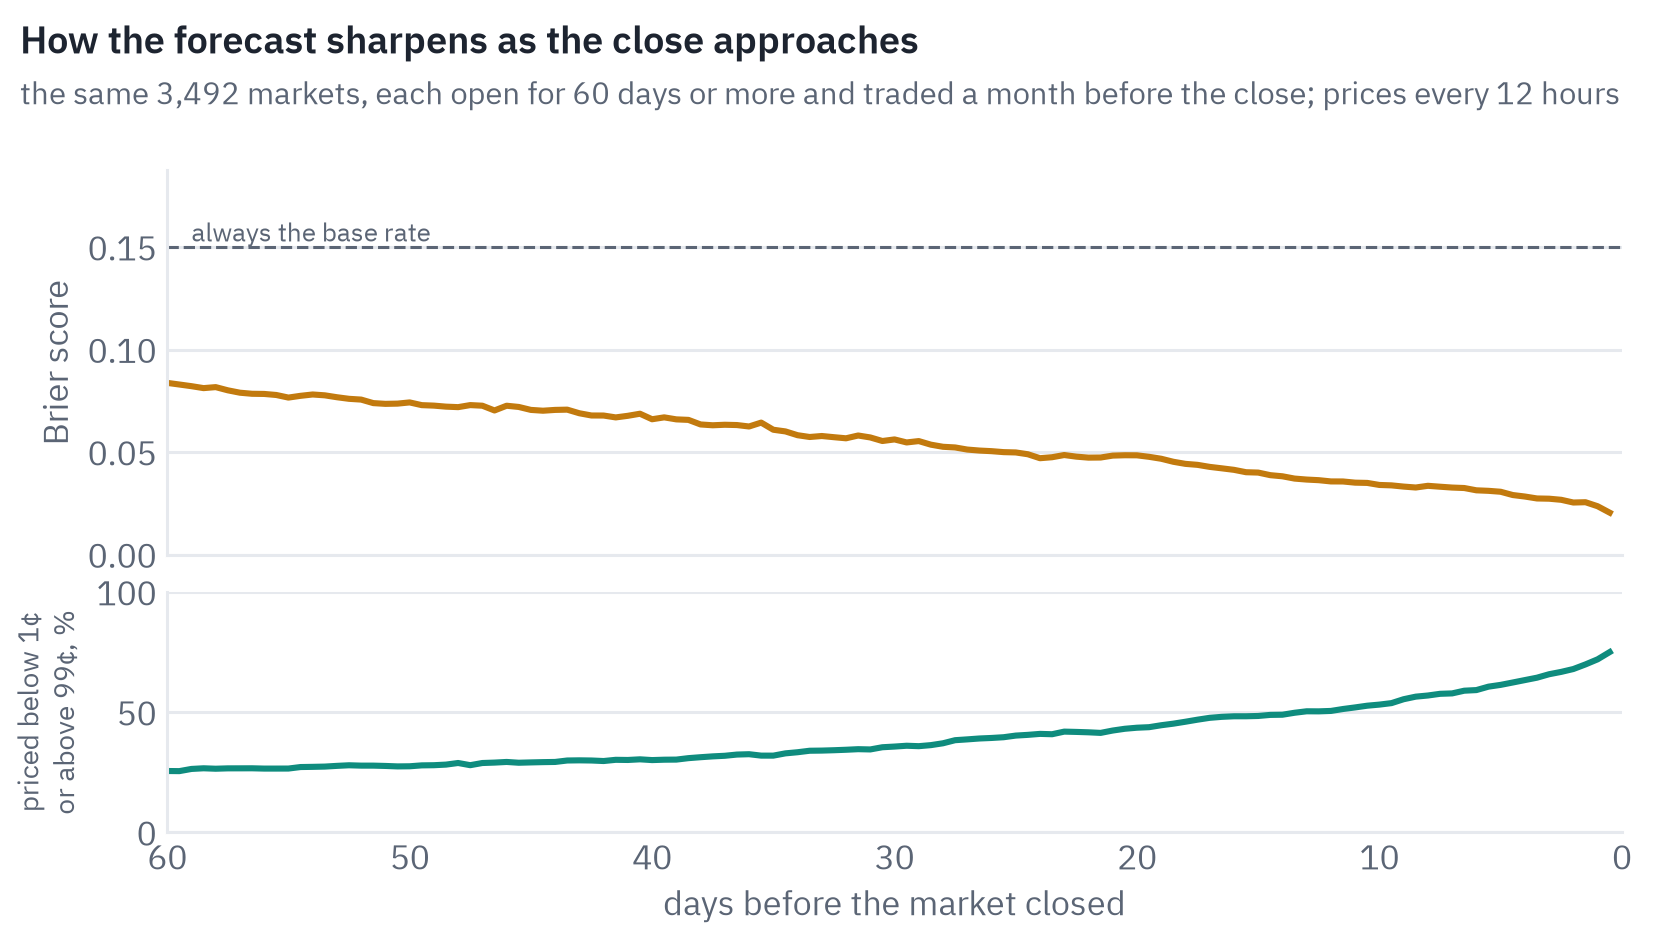
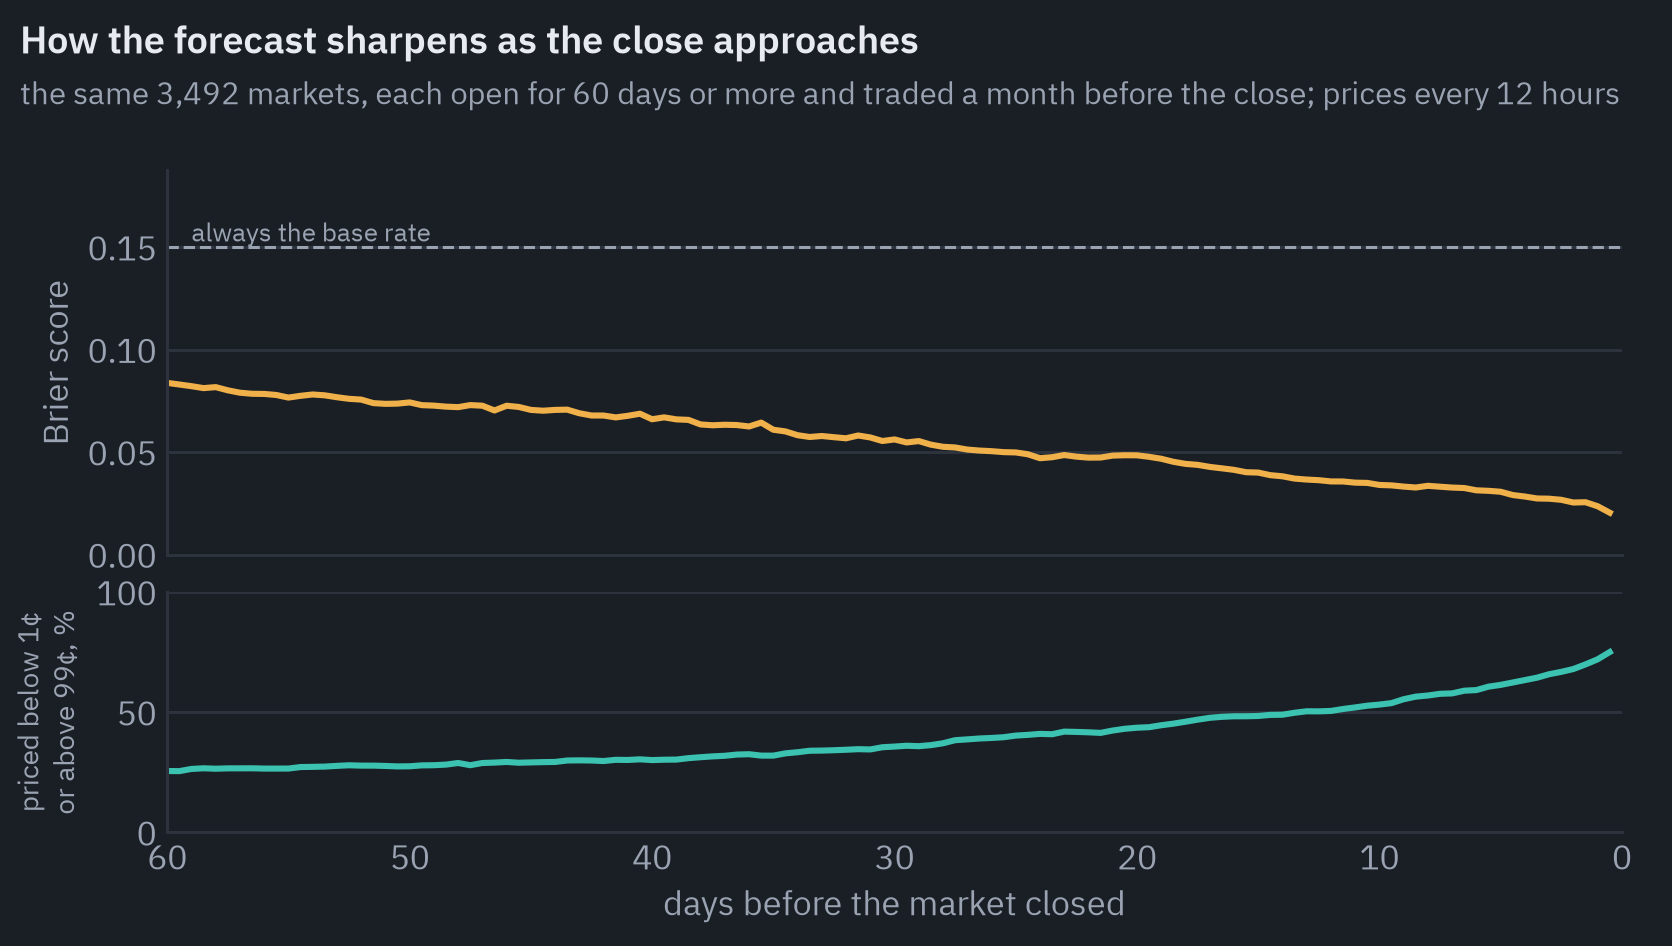
Sixty days before the close, the 3,492 markets that lived that long and were traded a month out already score 0.084, well below the base rate’s 0.150.
The score falls steadily, to 0.056 a month out and 0.033 a week out, and drops again in the last days, when scheduled events (a vote, a match, a data release) take place.
The lower panel counts the markets already priced at the extremes, below a cent or above 99 cents: a quarter of them at sixty days, more than half a week out, three quarters at the end. A market at 99.5 cents is not a forecast any more; it is a receipt waiting to be cashed.
The volume trap
The obvious next question is whether big markets forecast better than small ones, and the obvious way to answer it is to group markets by the dollars traded. Polymarket’s accuracy page does exactly this. It is a trap, and I walked into it first.
My first sample took every market with more than $100,000 traded and a share of those between $10,000 and $100,000, the way one naturally filters out dead markets.
In that sample, contracts priced between 10 and 20 cents a week before the close returned 25% on average, and the bigger the market, the more the longshots won.
It looked like the reverse of everything the racetrack literature says, and a trading strategy in one line. Here are the longshots of the sample drawn by topic, grouped two ways.
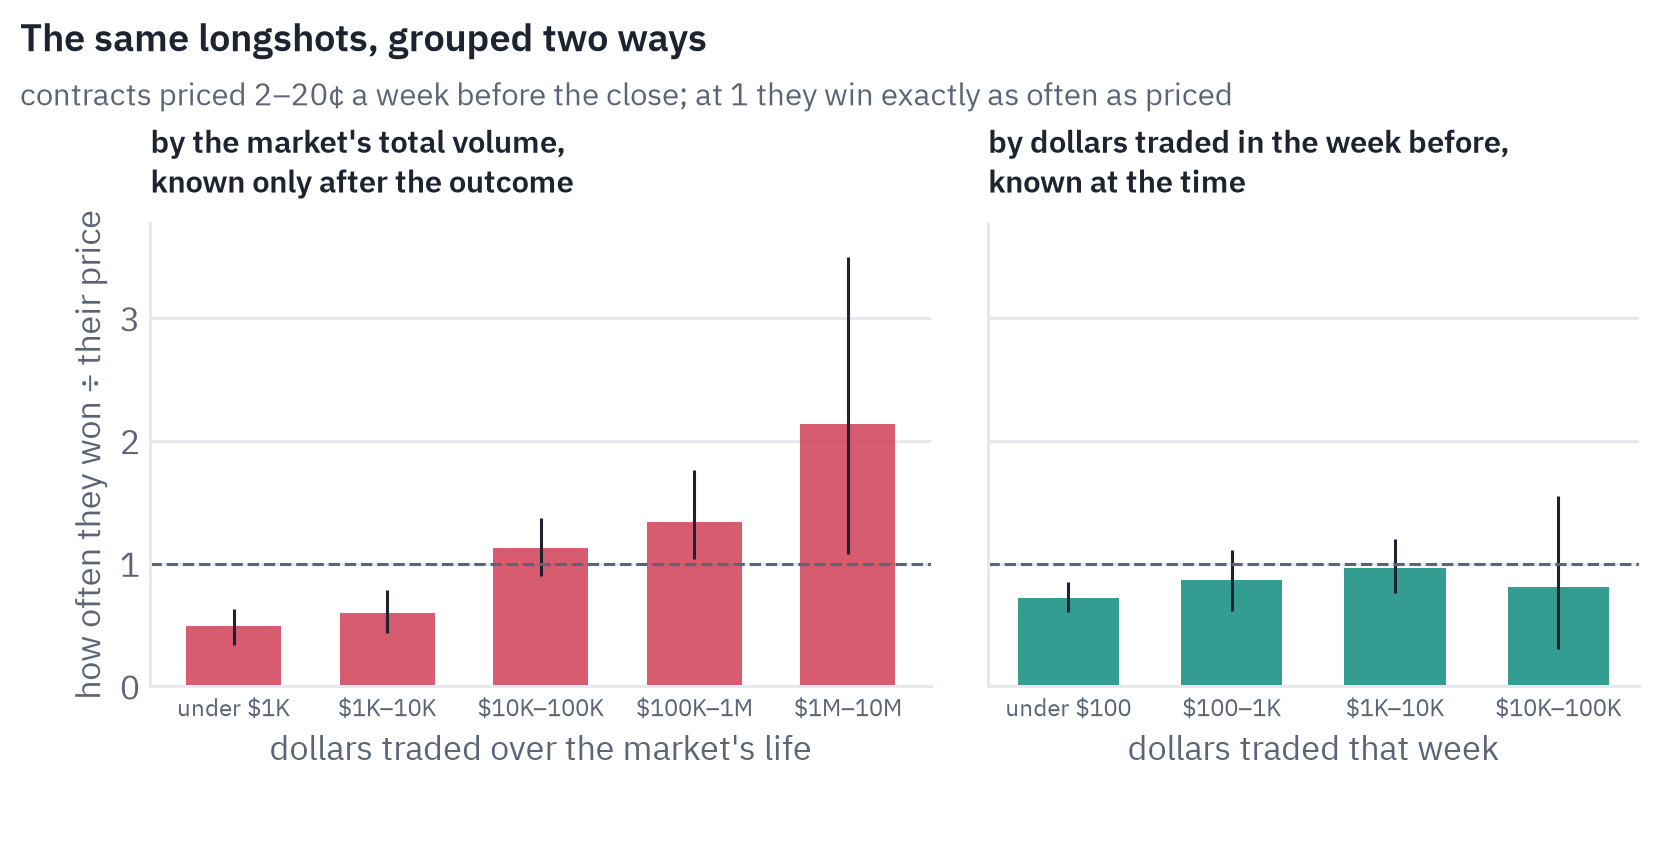
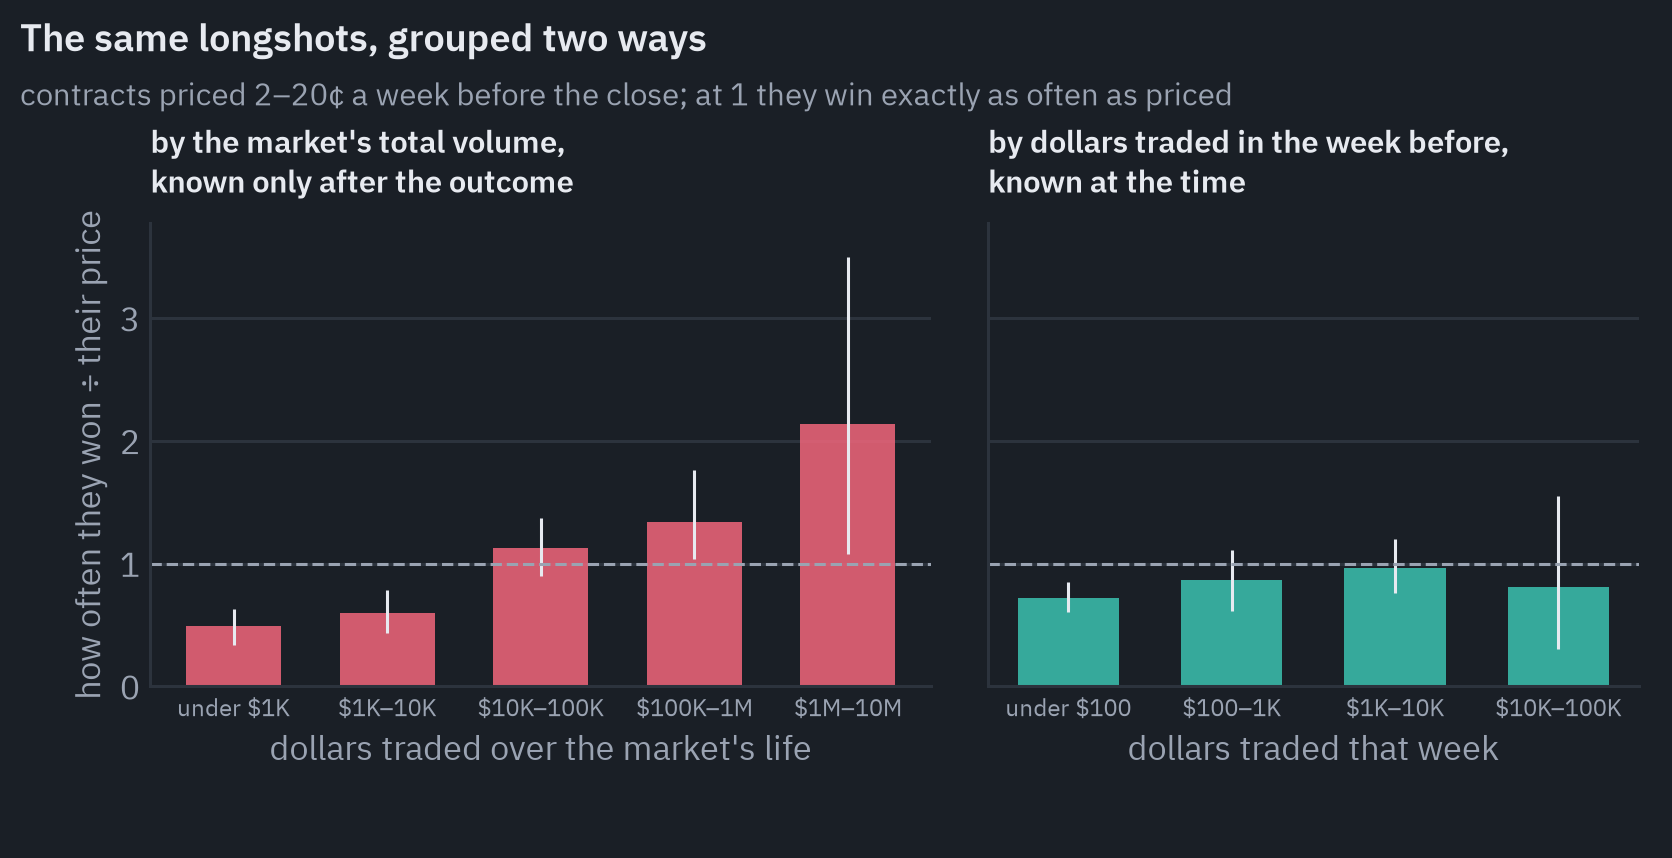
On the left, grouped by the dollars a market traded over its whole life, contracts priced 2 to 20 cents won about half as often as priced in markets under $1,000 (a ratio of 0.49) and twice as often in markets of $1–10 million (2.14).
On the right, the same contracts grouped by the dollars traded in the week before the forecast show nothing of the kind: 0.72 in the thinnest markets, 0.87 and 0.96 as trading grows. Favourites mirror it, from 1.05 to 0.88 on the left and flat at about 1.0 on the right.
The left panel is an artefact, and the reason is in what volume counts. A market’s total volume includes all the trading after the forecast, and nothing makes people trade like a surprise.
When a 10-cent candidate starts winning, the market fills with buyers, sellers, hedgers and spectators, and its volume jumps; when the favourite wins as expected, the market stays quiet and small. So sorting markets by total volume quietly sorts them by whether the unlikely happened.
In statistics this is selection on a consequence of the outcome, the same family of error as look-ahead bias in a backtest, which I wrote about in the post on AI crypto trading bots. Polymarket’s own accuracy page breaks its Brier scores down by volume in exactly this way.
The right panel is the honest version, because the week before a forecast is over when the forecast is made. It says something useful: in thin markets longshots are overpriced, and the more a market trades, the closer to fair they become.
That is why the rest of this post, like the calibration above, uses the test of $1,000 traded in the week before and never groups markets by their total volume.
Longshots and favourites
Calibration is an average, and averages hide the tails. The tails are where traders make or lose money, and economists have known for seventy years where to look: at the racetrack, bettors overpay for longshots and underpay for favourites[18].
In six million American horse races, betting on horses at 100 to 1 or longer lost about 61% of the stake, while betting on the favourite in every race lost only 5.5%[19]. On Kalshi, contracts bought below 10 cents lost over 60% of the money put into them[20].
To look for it on Polymarket, I treated both sides of every market as a contract: a Yes at the price \(p\) and a No at \(1 - p\). Buying a contract at price \(p\) that pays \(y \in \{0, 1\}\) returns \(y / p - 1\) on the stake. If prices were exact probabilities, the average return in every price band would be zero.
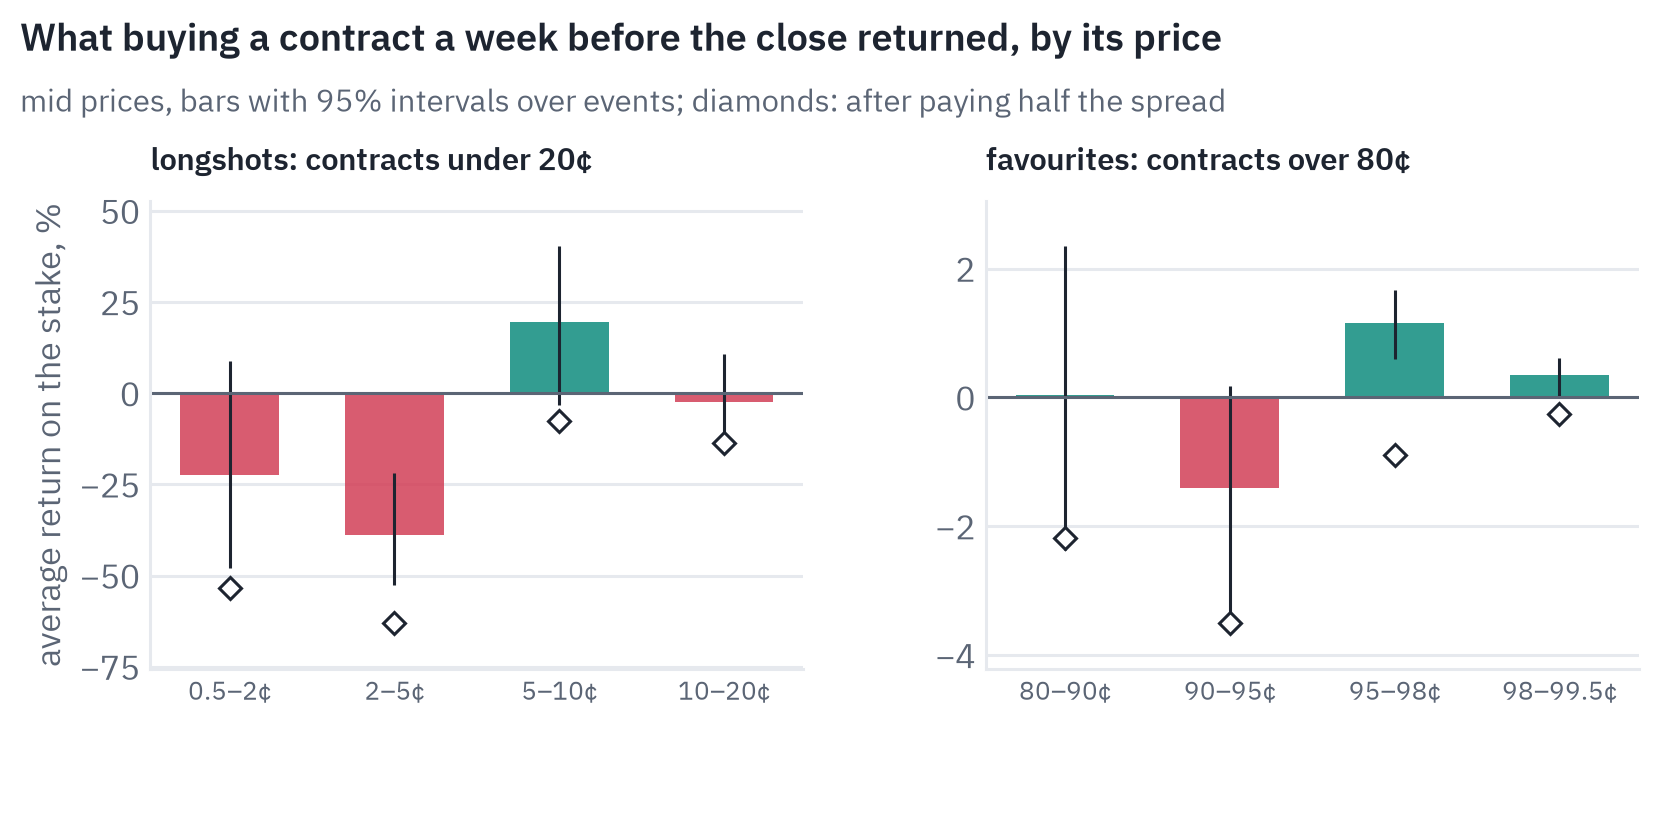
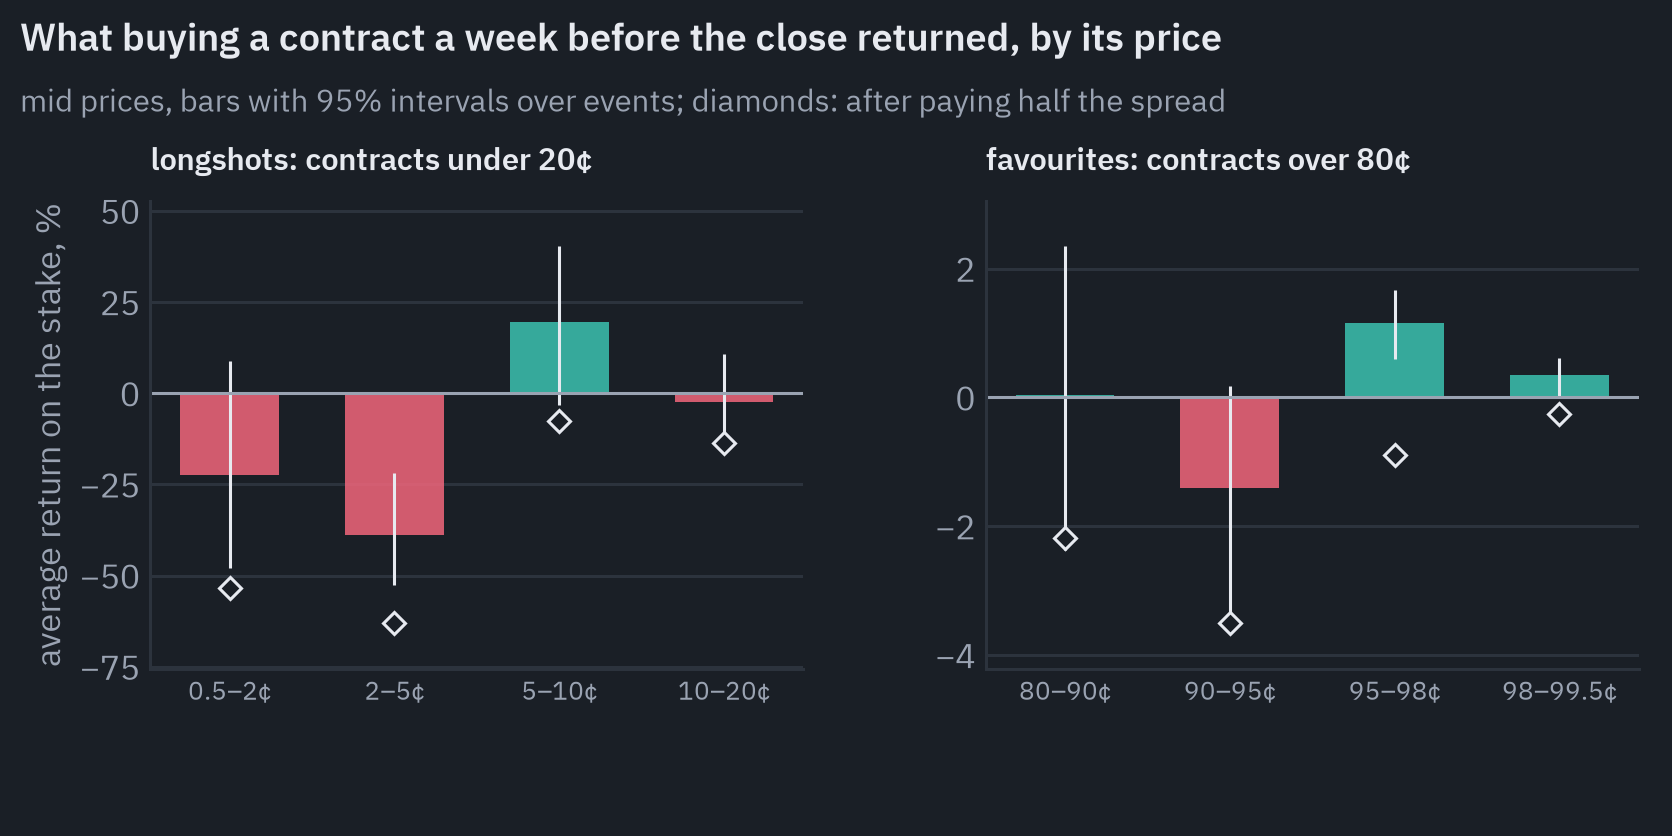
The bias is there, and it lives at the extremes. Contracts priced between 2 and 5 cents a week before the close won 2.1% of the time while costing 3.2 cents on average, so buying them lost 39% of the stake, with a 95% interval from −53% to −22%.
The cheapest band, under 2 cents, lost 22%, with an interval wide enough to include zero.
At the other end, contracts at 95 to 98 cents won 97.8% of the time and returned 1.15% in the week, and those at 98 to 99.5 cents returned 0.35%; both intervals stay above zero. Between 5 and 95 cents the averages cannot be told apart from zero.
How contracts are weighted matters for this kind of result. A study of 588 million Polymarket trades found that buys under 10 cents lost 19.3 cents per dollar when weighted by the money traded, 6.3 cents when each contract counted once, and gained 4.1 cents when related contracts were first grouped by event[21].
My numbers count each market once, weighted to the population of markets, with uncertainty from resampling whole events.
A favourite at 97 cents that earns a percent in a week sounds like free money, and it is not. The bars are mid prices, and nobody buys at the mid.
The downside is a total loss on the rare occasion the favourite fails, and the 50-50 resolutions I excluded would cost a favourite buyer half the stake; at about 0.4% of markets they take back up to 0.2 points of that return.
What trading costs
The price shown is the middle of the order book, but a buyer pays the ask. On the last night of October I recorded the best bid and ask of all 124,068 open markets, 57,468 of them with orders on both sides, and measured what buying at the ask costs above the middle, as a share of the price paid.
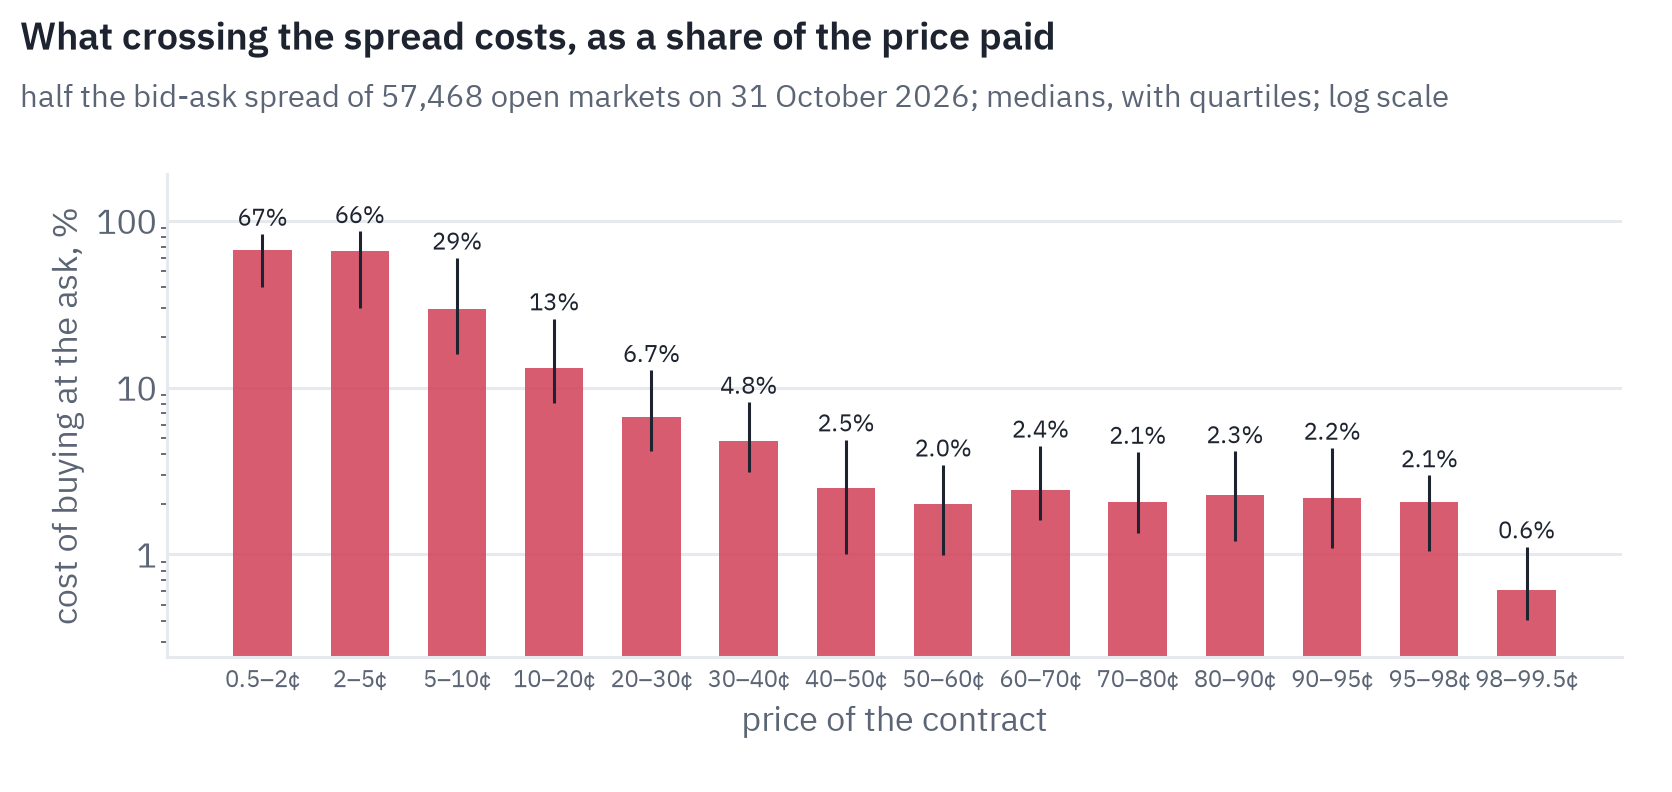
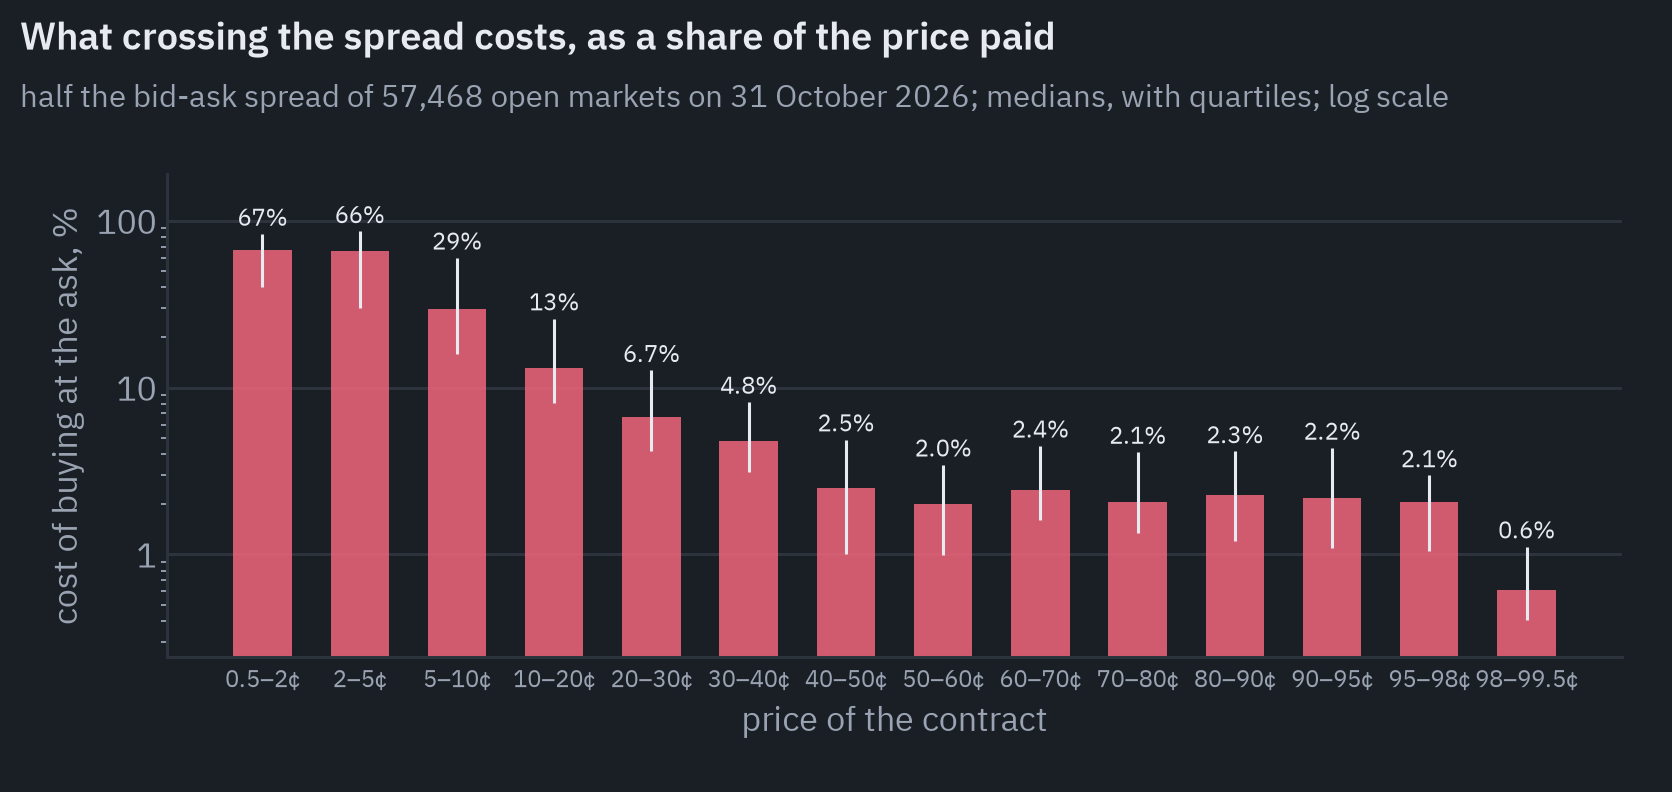
For contracts between 40 and 95 cents the median cost is about 2% of the price. Below 20 cents it explodes: 13% for contracts at 10 to 20 cents, 29% at 5 to 10, and about two thirds of the price under 5 cents.
A two-cent contract with a bid at one cent and an ask at three costs a full cent above its middle, half of what it is worth on paper. At the other end, near-certain contracts above 98 cents are cheap to buy, 0.6% of the price.
On top of the spread comes the fee. Since 30 March 2026 a taker on most categories pays \(r \cdot p(1 - p)\) per share, where \(p\) is the price and the rate \(r\) is 0.04 for politics, 0.05 for sports and most other categories and 0.07 for crypto; makers pay nothing, and geopolitical markets are free[7].
As a share of the money paid that is \(r(1 - p)\): about 5% of the stake for a 5-cent sports contract, a quarter of a percent for a 95-cent one.
Many of the busiest markets ran with the fee switched off on the day I looked, so the rate has to be checked market by market.
Put together, a longshot buyer who crosses the spread gives up between a tenth and two thirds of the stake before the event even happens.
A favourite buyer gives up a couple of percent, more than the whole edge the previous chart found: after half the spread the 95–98 cent band goes from +1.15% to −0.9% a week, and the 98–99.5 cent band from +0.35% to −0.3%. The diamonds on that chart show it.
Topics
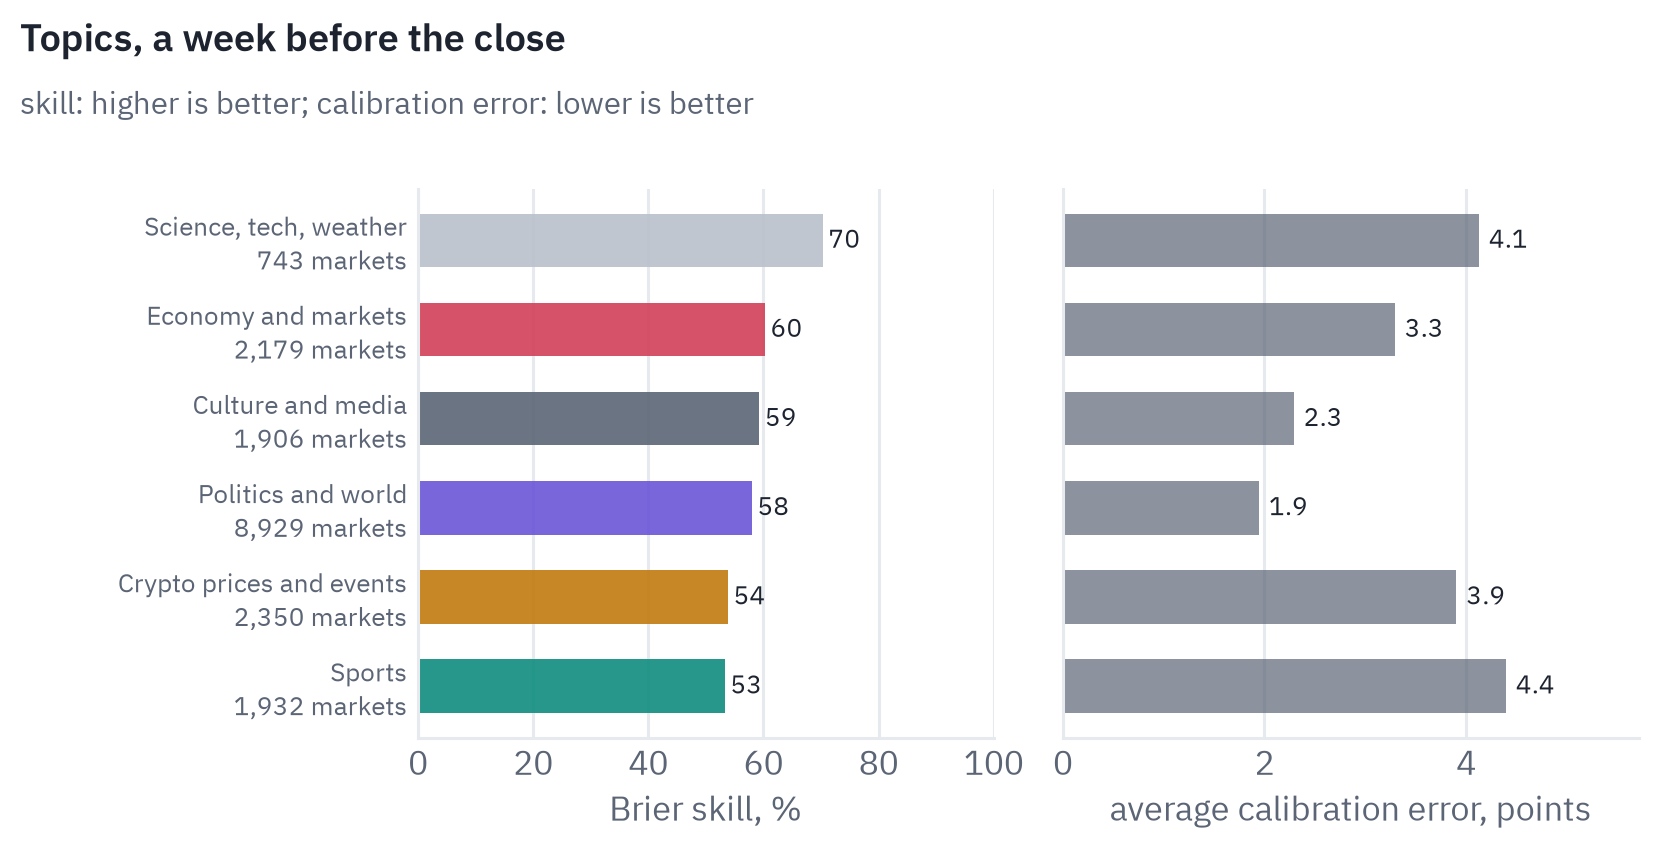
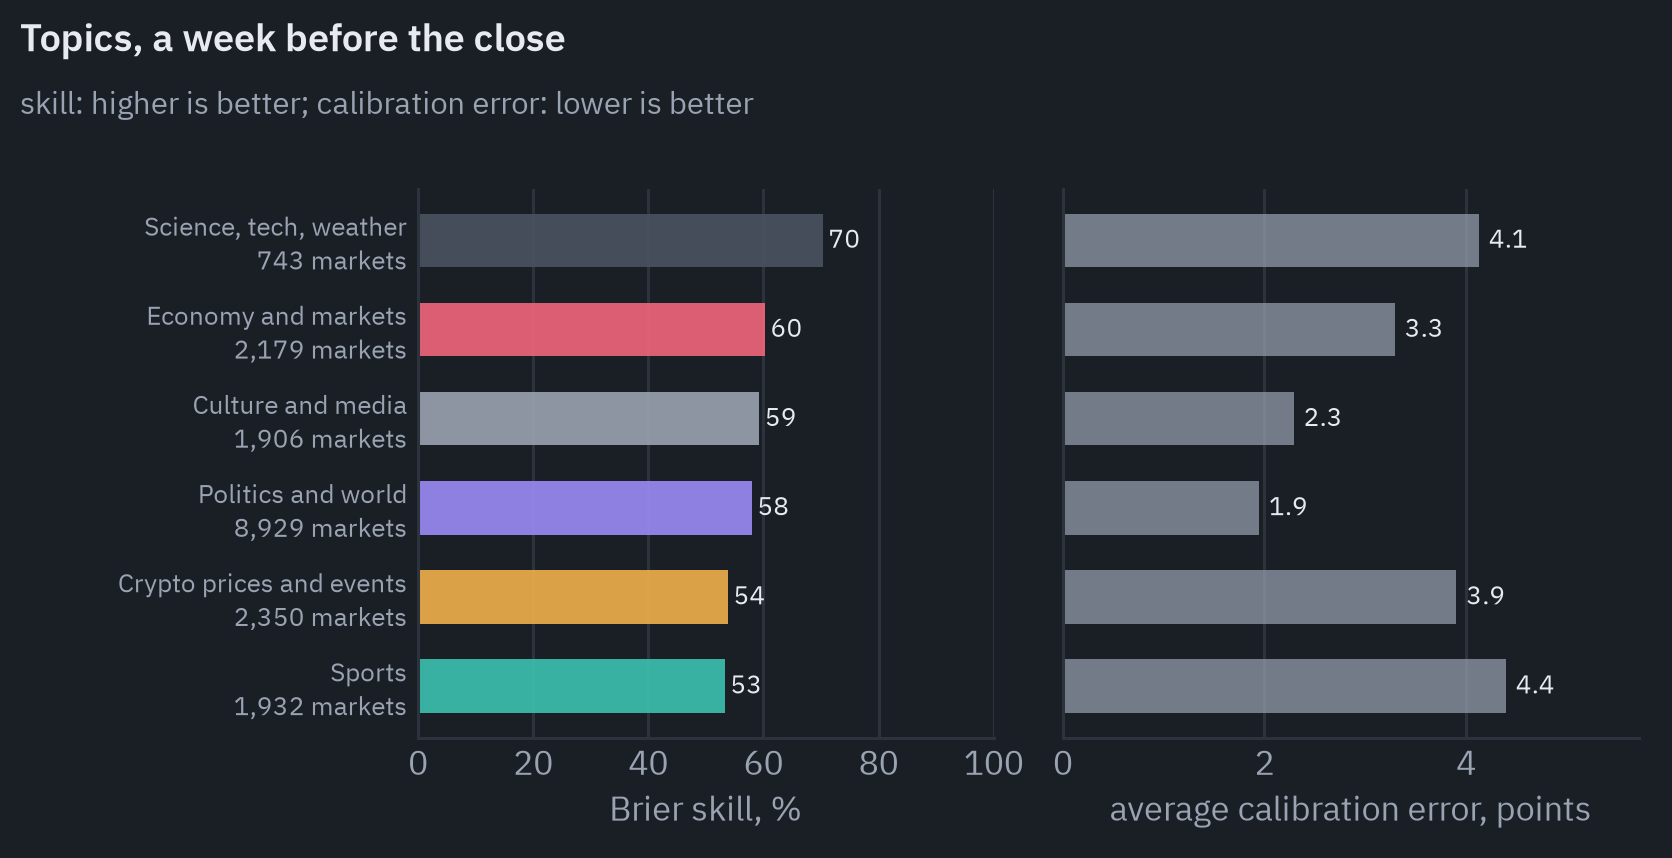
A week before the close, markets with real trading are skilled in every topic, from about 53% of the base rate’s error removed in sports and crypto to 70% in science and weather.
Politics, with 8,929 markets the largest group, is also the best calibrated, with an average gap of 1.9 points; sports and science have the largest gaps, 4.4 and 4.1, with crypto close behind at 3.9. Sports here means the markets traded a week before the close, mostly season futures (who wins the league, who wins the award) rather than single games, which are listed only days before kick-off.
Crypto deserves a chart of its own, because its errors have a cause that has nothing to do with the traders’ judgement.
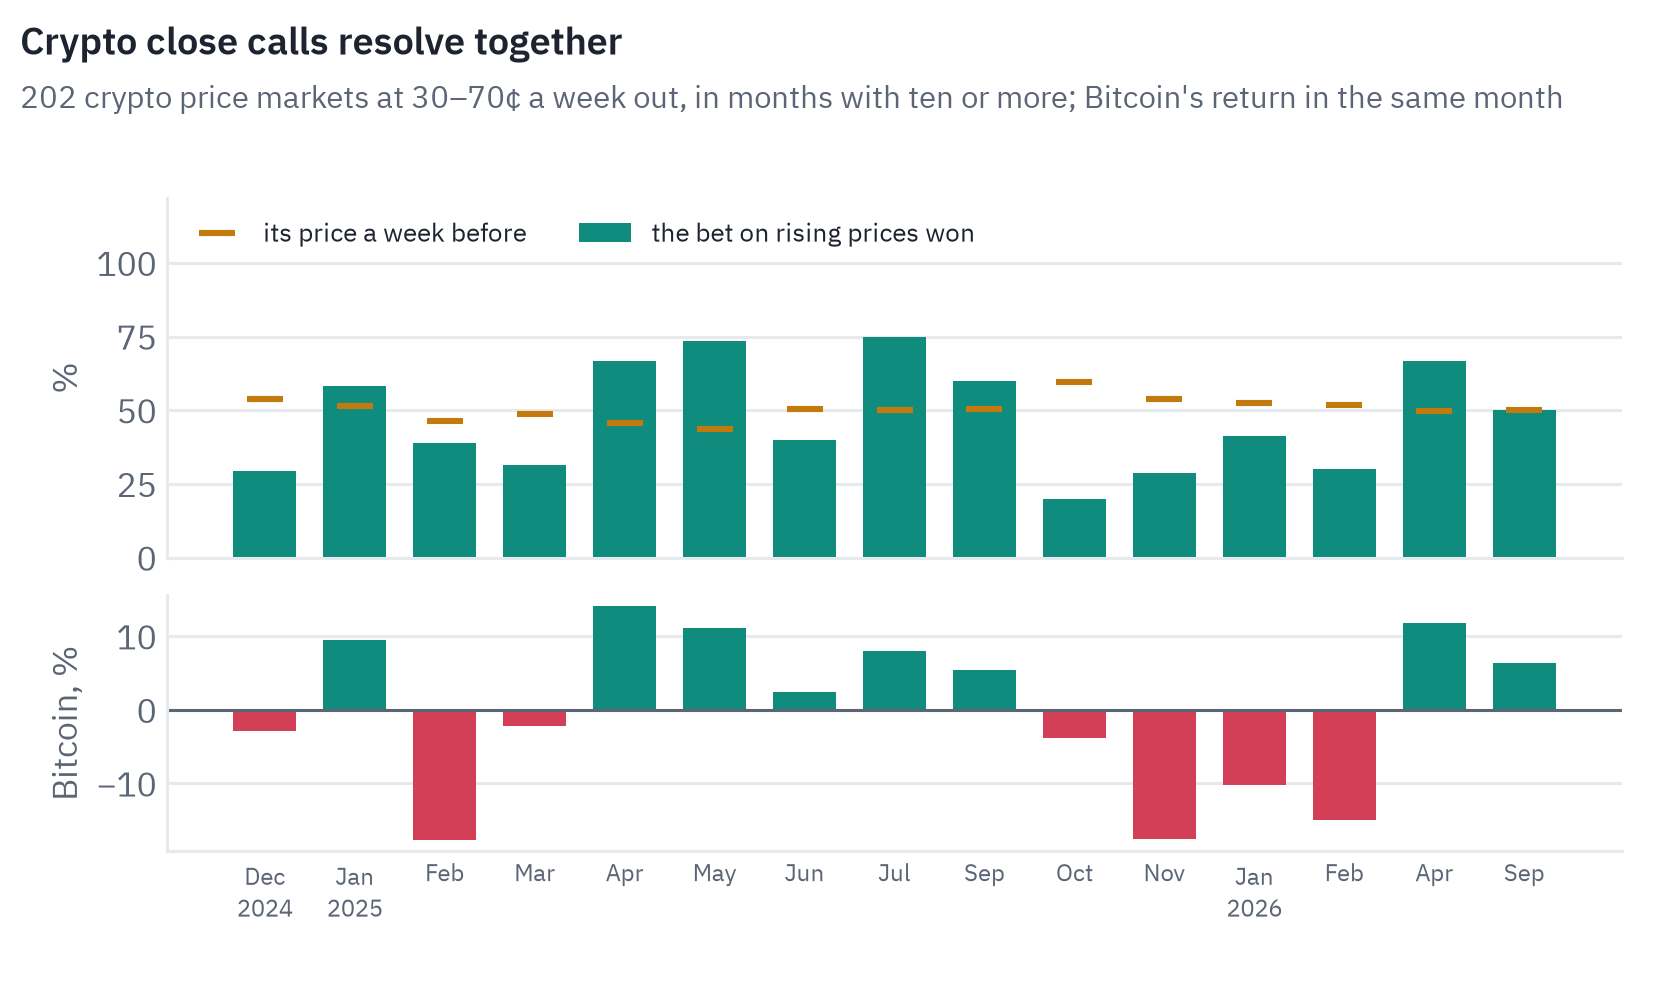
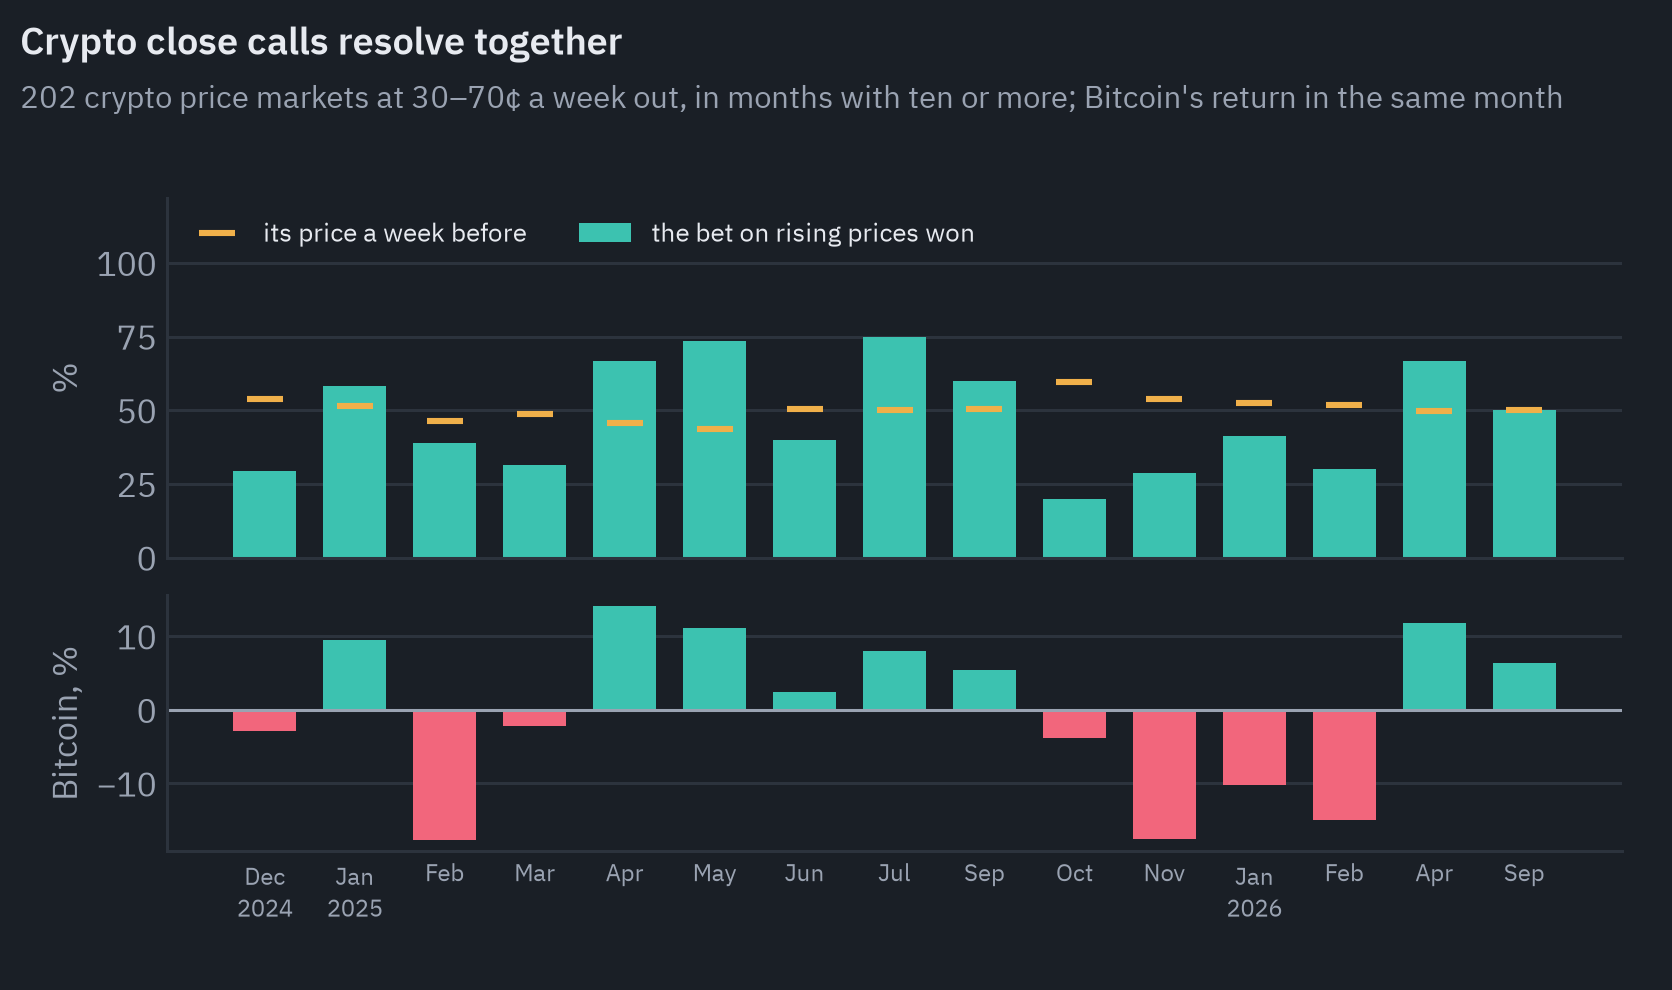
Most crypto markets ask about one number, the price of Bitcoin or Ether on a date. Take the close calls, markets priced between 30 and 70 cents a week out, and orient each so that Yes means the price went up.
In the months when Bitcoin rose, the bet on rising prices won 63% of the time; in the months when it fell, 32%. Its price a week before was about 50 cents in both. Across fifteen months, the share of winning bullish bets and Bitcoin’s monthly return have a correlation of 0.78.
The market was not wrong in any useful sense: a week before the close nobody knew which way Bitcoin would go, and 50 cents was a fair price for a coin toss. But a dozen such markets in one month are not a dozen tosses.
They are one toss recorded a dozen times, and a calibration chart of crypto markets mostly shows whether the period studied was a good one for Bitcoin. Calibration needs independent questions, which is why I resample whole events rather than markets, and why even that understates the uncertainty for crypto.
Long-dated markets and the price of money
A market that resolves in six months has to pay its traders for waiting. A No share at 95 cents on a question that will almost certainly resolve No pays 5 cents on 95 after half a year, about 10.8% a year, if it pays at all; three-month US Treasury bills paid 4.07% on average in 2025 and 3.71% so far in 2026[22].
Traders who could earn interest elsewhere will not bid near-certain long-dated contracts all the way to a dollar, and the people with the most money to commit, favourite buyers, drop out first.
Page and Clemen found the result on the old Intrade exchange: markets far from expiry were poorly calibrated, with prices “systematically biased toward 0.50”[23].
Polymarket noticed. Since September 2025 it has paid interest on positions in a short list of long-dated markets “to keep long-term pricing accurate”, 4% a year at launch and 3.25% since June 2026[24].
The list holds about eighteen events, the 2028 presidential race and the midterms among them. Every other market pays nothing for waiting.
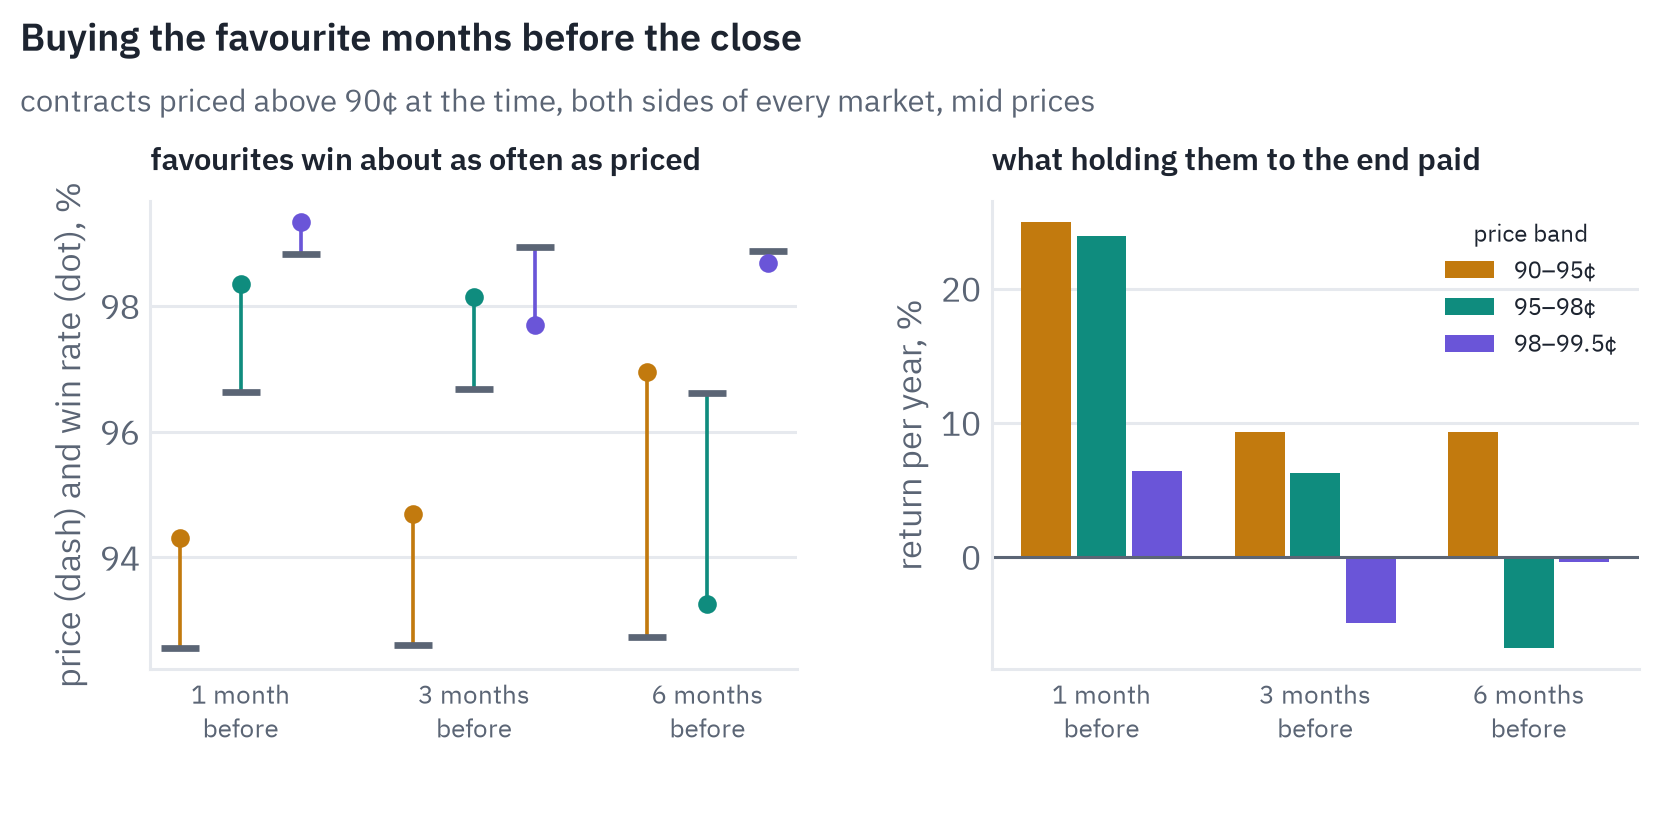
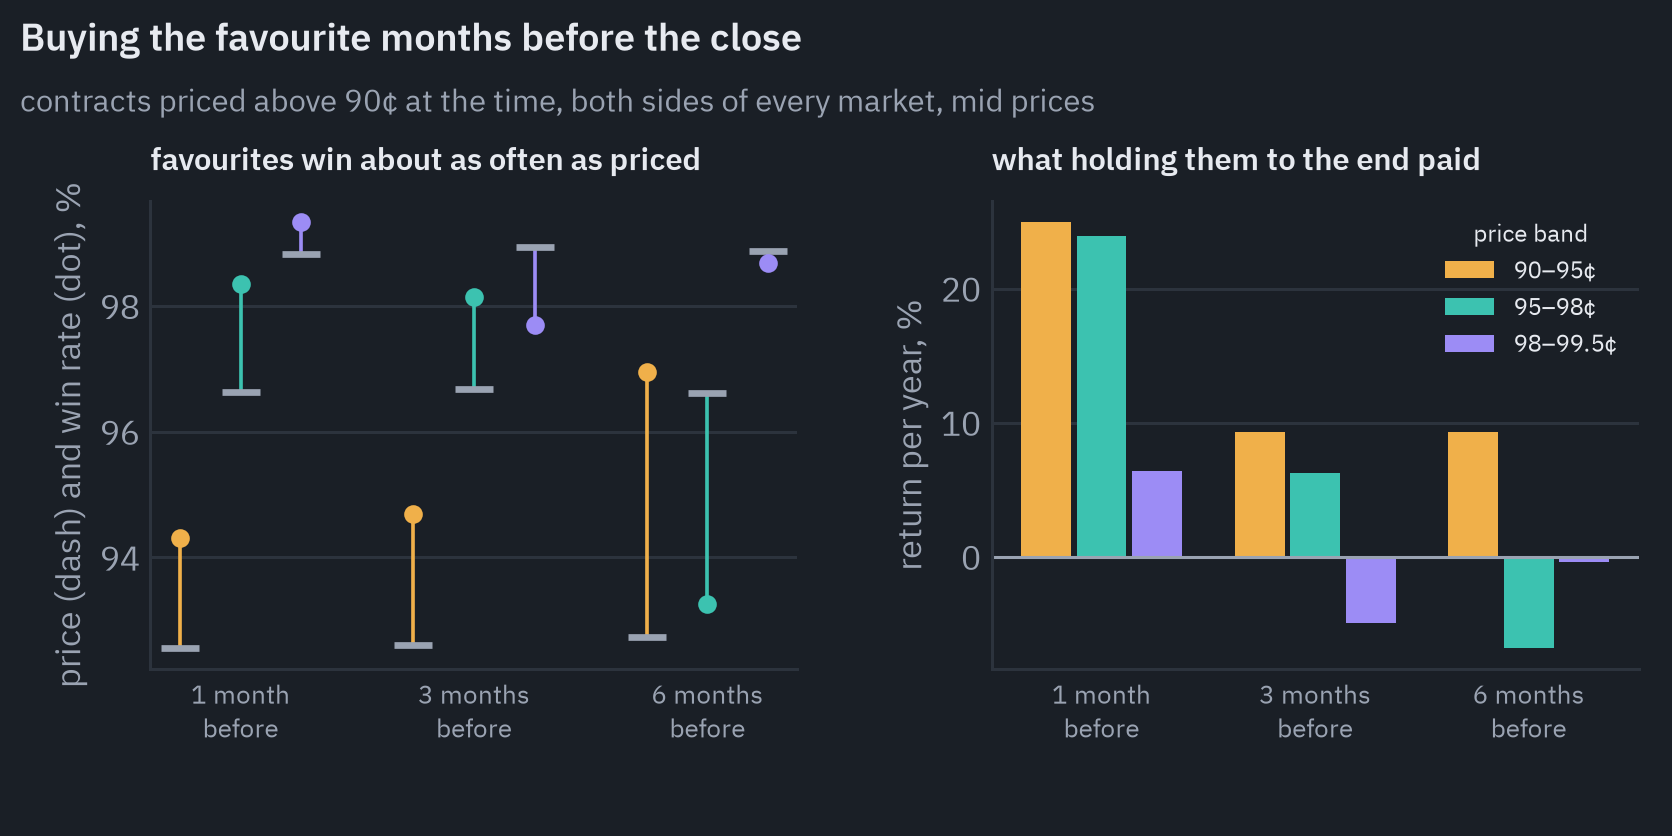
Polymarket shows the same thing. Contracts priced between 90 and 95 cents a month before the close won 94.3% of the time against a price of 92.6, and those at 95 to 98 cents won 98.4% against 96.6.
Held to the end, both earned about 1.8% in a month, which compounds to roughly 25% a year, six times what a Treasury bill paid.
Three months out, the same two bands earned 6 to 9% a year and the most expensive band lost money; six months out the samples are small and the results noisy.
The pattern fits Page and Clemen: near-certain long-dated contracts are a little too cheap, and the discount is about what impatient money charges. It is not free money either.
These are mid prices, a single failure costs the whole stake, and a trader who buys favourites a month out is lending to the market at a rate that has to cover the risk that the near-certain doesn’t happen.
A correction that doesn’t help
An engineer looking at the calibration chart will ask the obvious question: if the market is slightly off in a systematic way, can a model correct it? This is the same move as calibrating a classifier. Fit two numbers, \(a\) and \(b\), so that a corrected probability
\[\hat q = \sigma\big(a \cdot \operatorname{logit}(p) + b\big), \qquad \operatorname{logit}(p) = \ln \frac{p}{1 - p}, \quad \sigma(z) = \frac{1}{1 + e^{-z}},\]fits the outcomes better. With \(b = 0\), a slope \(a > 1\) means the prices should have been bolder, longshots cheaper and favourites dearer, and \(a < 1\) means they should have been more timid. This is Platt scaling, a standard way to recalibrate a classifier[25].
A Princeton thesis that fitted it to 188,509 Polymarket markets found a slope of 1.112[16], and a study of Kalshi and Polymarket found political markets “compressed toward 50%” in the same sense[26].
The interesting question is whether such a correction helps on markets it has not seen. I fitted \(a\) and \(b\) only on markets that closed before July 2025 and scored the correction on markets that closed after.
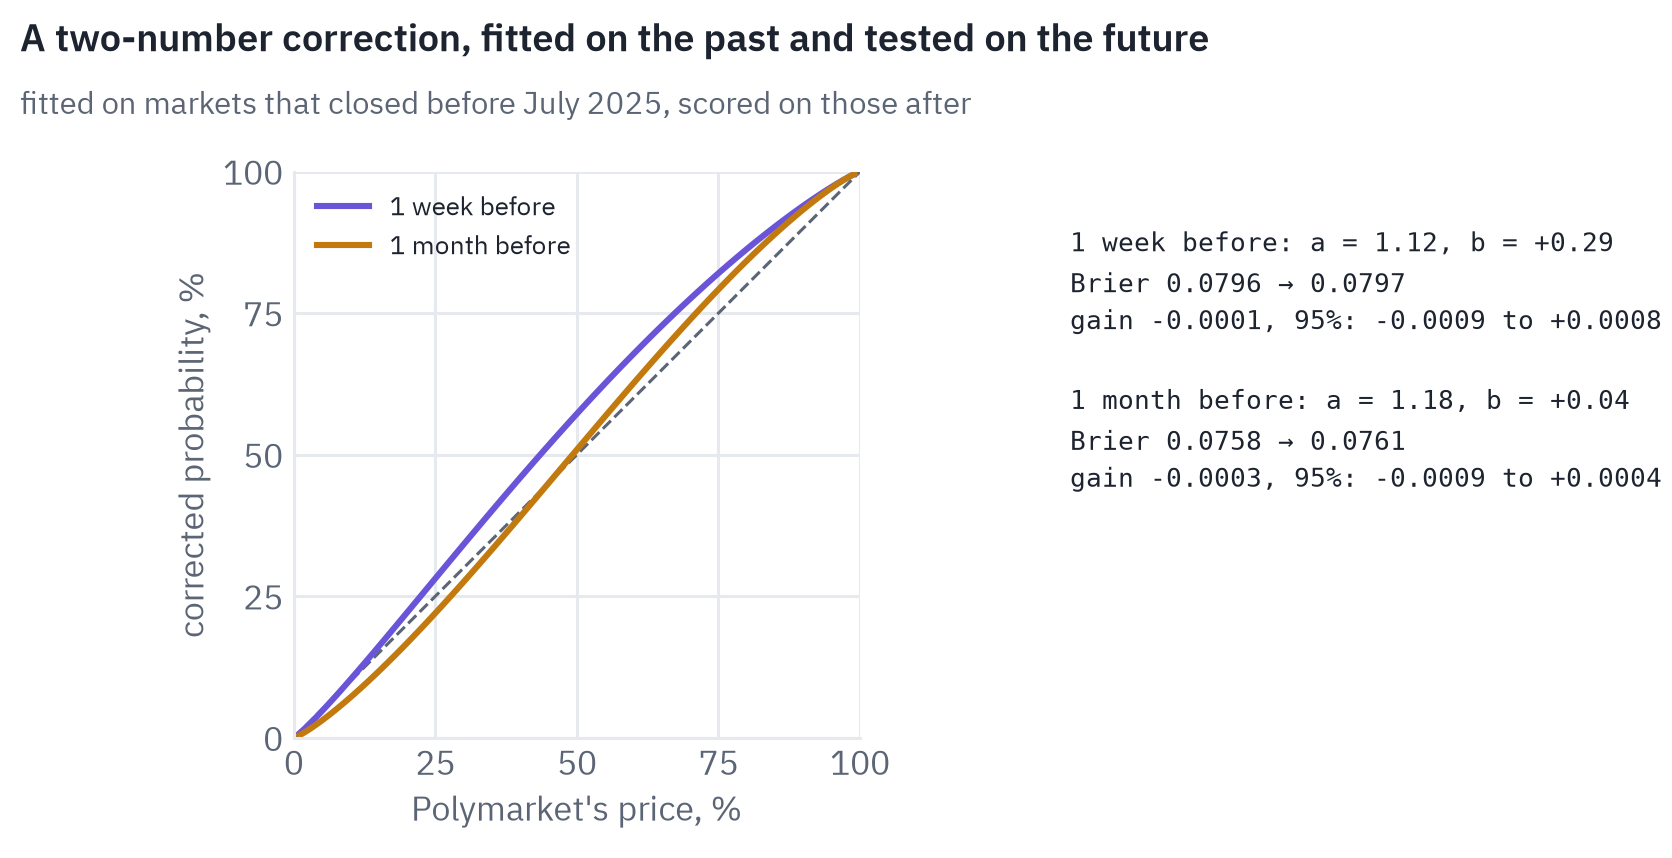
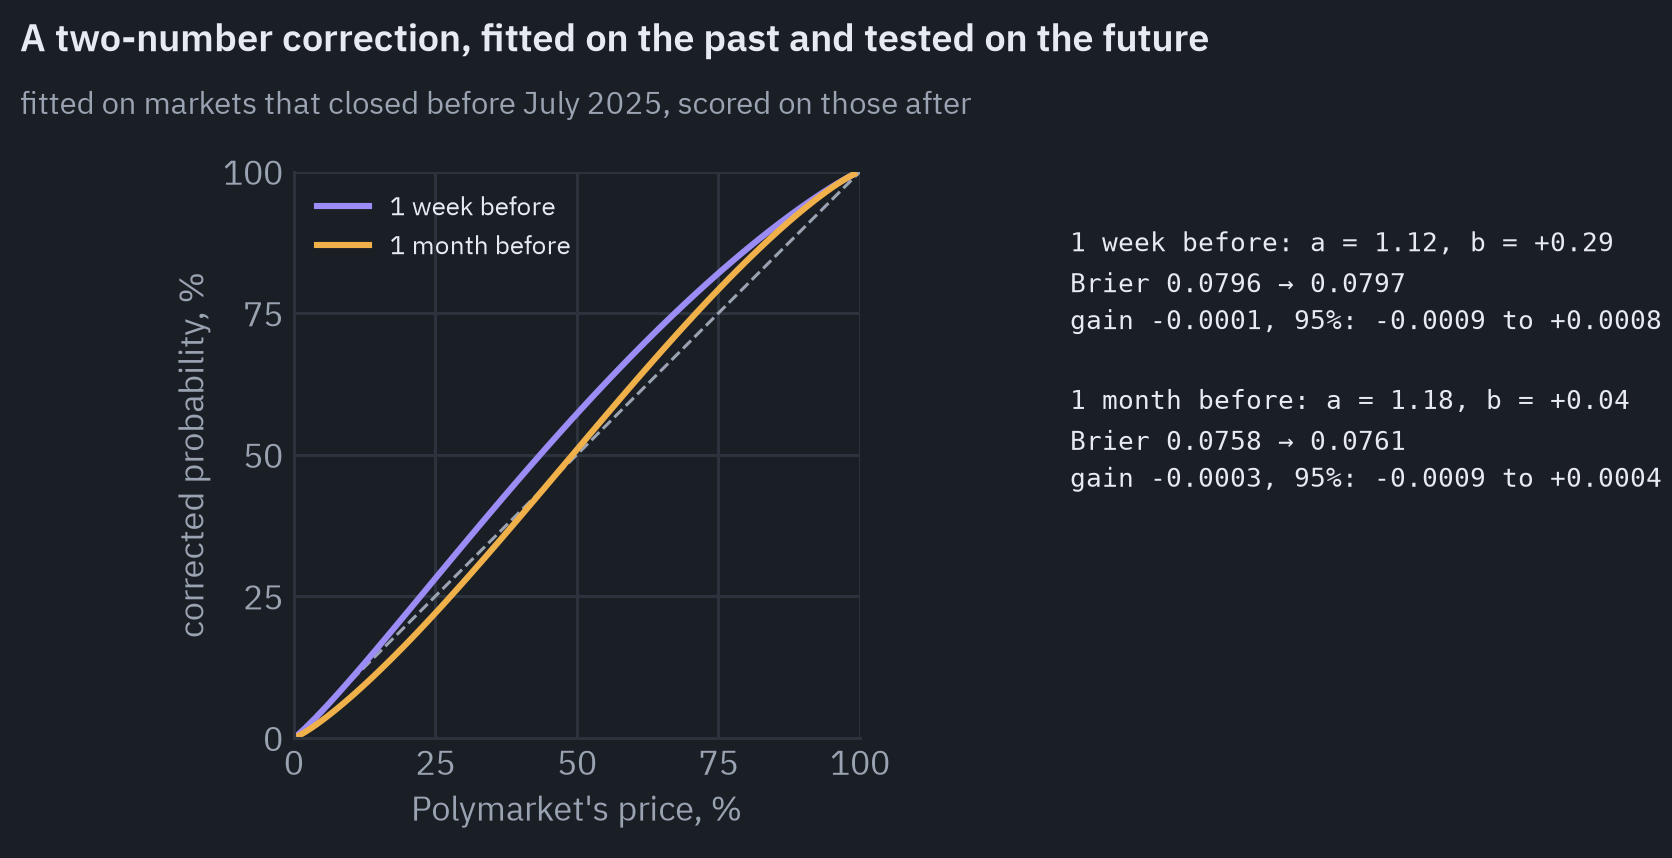
Fitted on the markets that closed before July 2025, the correction has a slope of 1.12 a week before the close and 1.18 a month before: the prices should have been a little bolder, the same compression the calibration chart showed, and close to Walker’s 1.112.
Applied to the 13,618 markets that closed later, it changes the Brier score a week out by −0.0001, with a 95% interval from −0.0009 to +0.0008, and a month out by −0.0003. In other words, nothing.
The bias is real on average, but too small and too unstable over time for a formula to turn it into a better forecast, let alone a profit after the spread.
When the market knows too early
The most impressive forecasts on Polymarket are sometimes not forecasts at all.
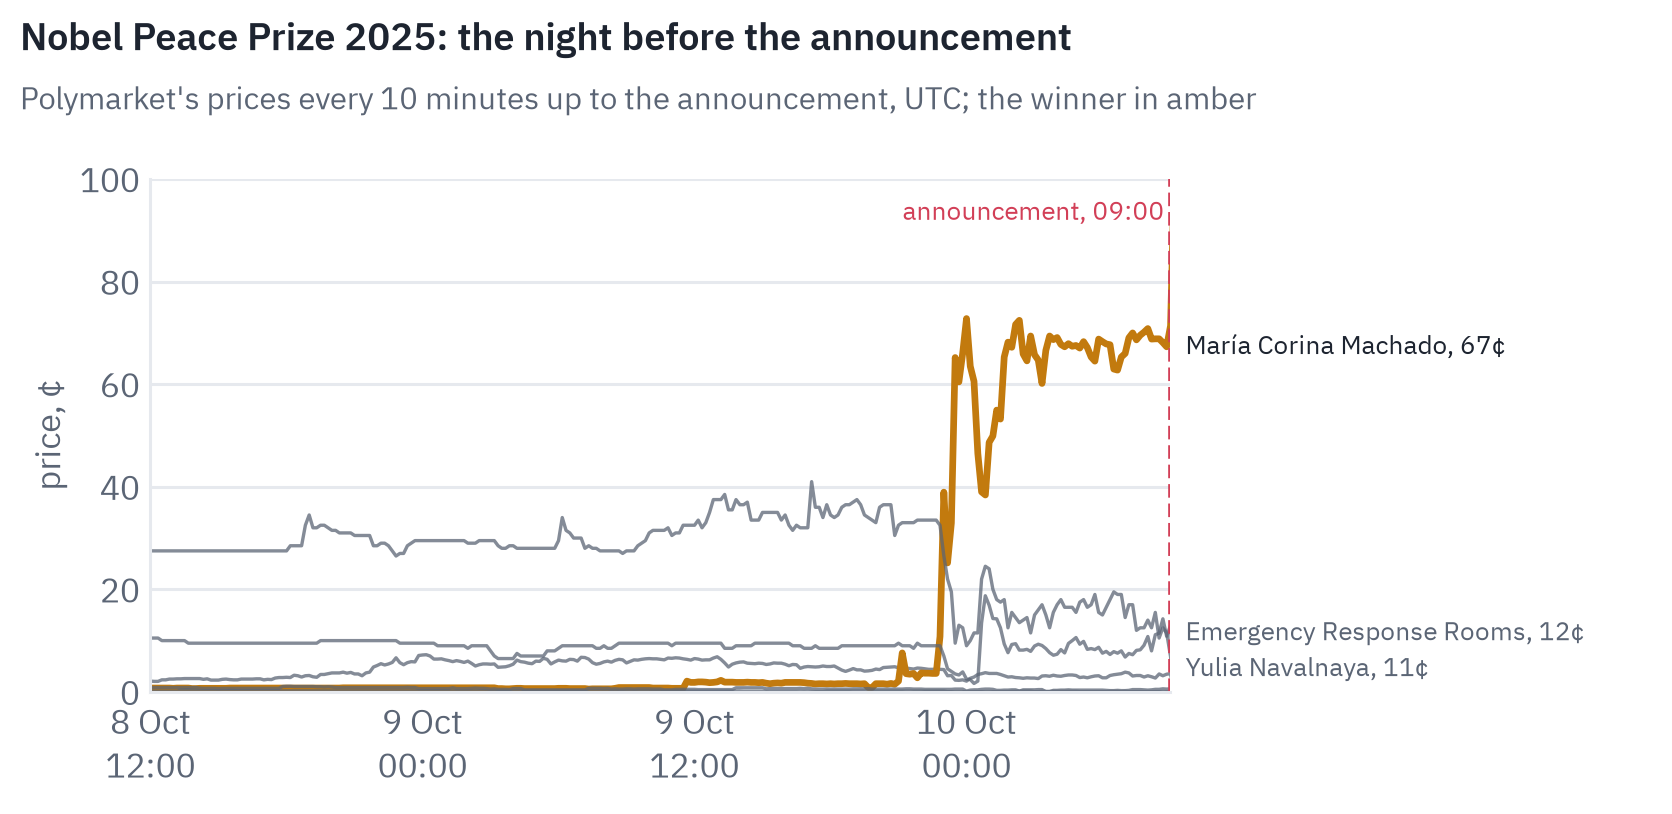
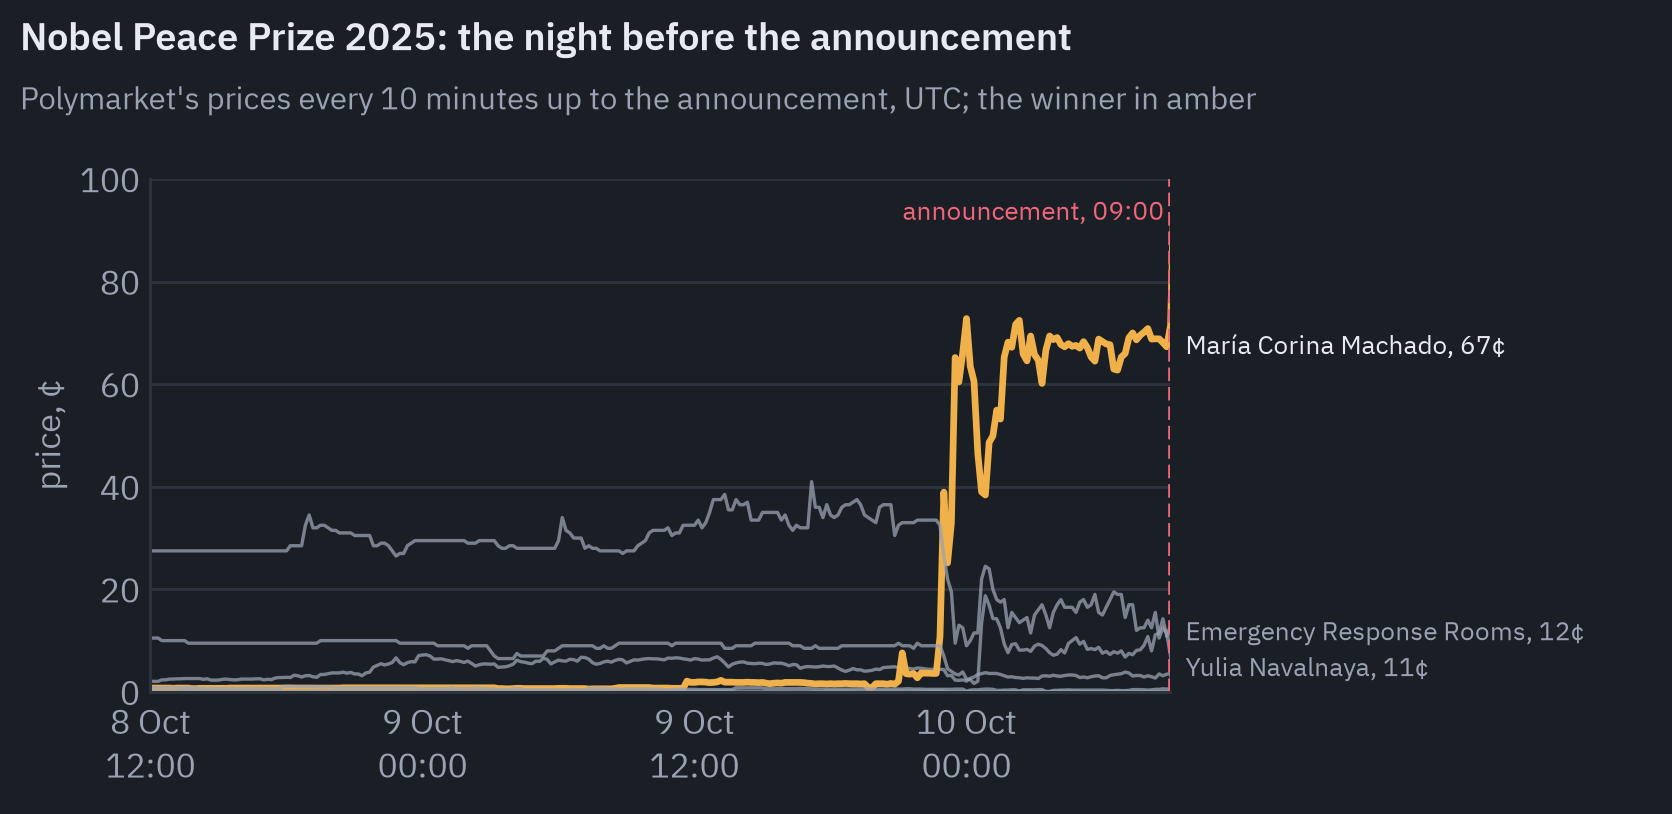
The Norwegian Nobel Committee announced the 2025 Peace Prize at 09:00 UTC on 10 October. For months María Corina Machado had traded at a cent or two. Shortly after midnight in Oslo her price started to climb, passed 43 cents before one in the morning and reached 73 by two[27].
In the price history I downloaded she was still at 67 cents five minutes before the announcement. An account created days earlier bought early and made tens of thousands of dollars.
The director of the Norwegian Nobel Institute said, “We take this very seriously”[28]. In January the institute concluded that the winner’s name had most likely leaked through “the digital domain” and that it could not say who was behind it[29].
That was not the only case. On the night of 2 January 2026, hours before Donald Trump announced the capture of Nicolás Maduro, a weeks-old account bet about $33,000 that Maduro would be out by the end of the month and made about $400,000.
In April the Justice Department charged a Special Forces master sergeant who had helped plan the operation, and the CFTC called it the first insider-trading case it had ever brought over event contracts[30, 31]. He has pleaded not guilty.
In May a Google engineer was charged over about $1.2 million made on markets about Google’s “Year in Search” lists, using, according to Google, marketing material he could see at work[32].
Hours before the US strikes on Iran on 28 February, six freshly funded wallets bought Yes on the strike market and made about a million dollars[33].
Polymarket’s chief executive once told CBS that insiders “having an edge to the market is a good thing”[34]. For accuracy, in a narrow sense, he is right: the price moved to the truth before the public knew it.
It is not prediction, though, and it is no use to an ordinary trader, who is the one on the other side of each of those trades. The company now says it referred the Maduro trader to the Justice Department itself.
In Congress, one bill would bar officials and their staff from trading on government decisions[35], and another would ban markets on elections, sports and military action altogether[36].
When the truth is decided by a vote
A share pays a dollar if the event happens, but someone has to say whether it happened. On Polymarket that someone is usually UMA’s optimistic oracle.
A proposer posts an outcome with a bond, typically $750; anyone can dispute it within two hours; after a second dispute the question goes to a vote of UMA token holders, which takes about two days[37].
Most markets resolve in two hours without a dispute. The ones that don’t are where prediction becomes a governance problem.
In March 2025 a $7 million market on whether Ukraine would agree to a minerals deal with the US before April resolved Yes, although Ukraine had not agreed; a single large token holder was accused of swinging the vote, and Polymarket called the situation “unprecedented” but paid no refunds, since “this wasn’t a market failure”[38].
That summer a market with hundreds of millions of dollars traded asked whether Volodymyr Zelensky would be photographed in a suit; he appeared at a NATO summit in a black jacket and matching trousers that many outlets called a suit, and UMA’s voters decided it was not[39].
In May 2026 Bloomberg found that nine wallets held about half of the UMA votes cast in Polymarket disputes over three years[40].
The platform has been narrowing the problem: since September 2025 only whitelisted proposers can propose outcomes, which cut disputes by two thirds in the first month[41], crypto price markets now settle from Chainlink prices without a vote, and a new contract system that can combine several oracles is due to switch on for new markets this week[42].
For a trader, resolution risk is a cost like the spread, small on most markets and large on exactly the ones with ambiguous wording.
Volume that isn’t
Volume is the number every article about Polymarket leads with, and it is the least reliable number on the platform.
Researchers at Columbia classified nearly 25% of Polymarket’s historical volume as consistent with wash trading, traders buying from and selling to themselves without changing their position; it peaked at nearly 60% of weekly volume in December 2024, and in sports markets it reached 45% of all-time volume[43].
Separately, Paradigm showed in December 2025 that most dashboards counted every trade twice, once for each side[44].
Neither changes the prices this post studies: a wash trade moves money in a circle, not the price. But together with the trap above, they are good reasons not to read a market’s volume as a measure of how much it knows.
What a Polymarket price is worth
As a probability, a Polymarket price on a market people actually trade is about as good as public forecasts get.
A week before the close the prices were calibrated to within 1.8 percentage points on average, and on the markets open for at least a month they removed 70% of the base-rate forecaster’s error a week out and 82% a day out.
When a liquid market says 70%, the honest reading is “about 70%”, give or take a few points.
That is a statement about many markets, not about one. The Senate at 71.5 cents is a single draw, and so was Brazil at 80. A calibrated price is still wrong three times in ten when it says 70, which is what 70 means.
The weak spots are where theory and the data agree they should be. Thin markets are not forecasts at all, and in them longshots are overpriced. Prices months before the close drift toward 50 cents, because waiting costs money and Polymarket pays for the wait on only a handful of markets.
Crypto price markets share one driver and resolve together, so a bad month for Bitcoin looks like miscalibration. Insiders sometimes move prices before the news, which makes the forecast right and the trade unfair. And the dollar arrives only if the oracle agrees that the event happened.
For a trader the useful findings are modest and specific. The mispricing that survives is at the tails: contracts under 5 cents lose a quarter to two fifths of the stake on average, and near-certain favourites earn a fraction of a percent a week, more when they are bought a month or more before the close.
It is about the size of the spread and the fee, which is why it survives. Nothing in the data suggests a general bias that a formula could exploit, and a two-number correction fitted on the past made the future no better.
The people who make money on Polymarket, according to a study of 588 million trades, are mostly the ones who post limit orders and let others cross the spread; the top 1% of profitable accounts took 76.5% of the profits[45].
For an engineer the lessons are the ones from evaluating any model, sharpened by a market’s habits. Accuracy flatters when the classes are unbalanced, and most questions resolve No. Comparisons across horizons are confounded by which questions exist at each horizon, so they have to be made on the same questions.
And a filter on anything that depends on the outcome, a market’s total volume included, manufactures effects that aren’t there. The trap that caught my first sample is the most transferable thing in this post.
References
- CNBC (2026). Lula wins Brazil election despite prediction markets favoring Bolsonaro. 26 October 2026. ↩
- Semafor (2026). Prediction markets flop on recent elections. 30 October 2026. ↩
- Polymarket (2026). pUSD. Documentation. ↩
- Polymarket (2026). Prices and the order book. Documentation. ↩
- Wolfers, J., & Zitzewitz, E. (2006). Interpreting prediction market prices as probabilities. NBER Working Paper 12200. ↩
- Manski, C. F. (2006). Interpreting the predictions of prediction markets. Economics Letters, 91(3), 425–429. ↩
- Polymarket (2026). Trading fees. Documentation. ↩
- Guo, C., Pleiss, G., Sun, Y., & Weinberger, K. Q. (2017). On calibration of modern neural networks. ICML 2017. ↩
- Dimitriadis, T., Gneiting, T., & Jordan, A. I. (2021). Stable reliability diagrams for probabilistic classifiers. PNAS, 118(8), e2016191118. ↩
- Brier, G. W. (1950). Verification of forecasts expressed in terms of probability. Monthly Weather Review, 78(1), 1–3. ↩
- Murphy, A. H. (1973). A new vector partition of the probability score. Journal of Applied Meteorology, 12(4), 595–600. ↩
- 538 (2024). 538’s final forecasts for the 2024 presidential election. Republished by 6abc, 5 November 2024. ↩
- The Wall Street Journal (2024). The Trump betting whale speaks out: “I have absolutely no political agenda”. Republished by To Vima, 1 November 2024. ↩
- CBS News (2025). French whale made over $80 million on Polymarket betting on Trump’s election win. 60 Minutes, 30 November 2025. ↩
- Horvitz, D. G., & Thompson, D. J. (1952). A generalization of sampling without replacement from a finite universe. Journal of the American Statistical Association, 47(260), 663–685. ↩
- Walker, A. (2026). The price is (almost) right: a calibration analysis of Polymarket pricing data. Senior thesis, Princeton University. ↩
- Polymarket (2026). How accurate is Polymarket? Accessed 31 October 2026. ↩
- Griffith, R. M. (1949). Odds adjustments by American horse-race bettors. American Journal of Psychology, 62(2), 290–294. ↩
- Snowberg, E., & Wolfers, J. (2010). Explaining the favorite–long shot bias: is it risk-love or misperceptions? Journal of Political Economy, 118(4), 723–746. ↩
- Bürgi, C., Deng, W., & Whelan, K. (2026). Makers and takers: the economics of the Kalshi prediction market. GWU Center for Economic Research Working Paper 2026-001. ↩
- Cardozo, M., & Rivero-Wildemauwe, J. I. (2026). The favorite-longshot bias in prediction markets: evidence from Polymarket. arXiv:2609.12878. ↩
- Federal Reserve Bank of St. Louis (2026). 3-month Treasury bill secondary market rate (DTB3). FRED. ↩
- Page, L., & Clemen, R. T. (2013). Do prediction markets produce well-calibrated probability forecasts? The Economic Journal, 123(568), 491–513. ↩
- Polymarket (2026). Holding rewards. Help center, 1 June 2026. ↩
- Niculescu-Mizil, A., & Caruana, R. (2005). Predicting good probabilities with supervised learning. ICML 2005. ↩
- Le, N. A. (2026). Decomposing crowd wisdom: domain-specific calibration dynamics in prediction markets. arXiv:2602.19520. ↩
- Decrypt (2025). Nobel Peace Prize organizers investigating Polymarket insider trades. 10 October 2025. ↩
- Bloomberg (2025). Unusual Polymarket bets on Peace Prize winner spur probe. Via Bloomberg Law, 10 October 2025. ↩
- Reuters (2026). Nobel committee says Peace Prize winner likely revealed early by digital spying. Via CP24, 30 January 2026. ↩
- U.S. Department of Justice (2026). U.S. soldier charged with using classified information to profit from prediction market bets. 23 April 2026. ↩
- Commodity Futures Trading Commission (2026). Press release 9217-26. 23 April 2026. ↩
- CBS News (2026). Google employee charged with insider trading on Polymarket. 28 May 2026. ↩
- The Block (2026). Fresh accounts netted $1 million on Polymarket hours before US airstrikes on Iran. 28 February 2026. ↩
- CBS News (2026). Polymarket trader made $400,000 on Maduro’s capture. 6 January 2026. ↩
- Torres, R. (2026). Rep. Ritchie Torres introduces legislation to crack down on insider trading on prediction markets. Press release. ↩
- Raskin, J. (2026). Raskin, Merkley legislation would ban prediction market gambling on elections, sports, war and government activity. Press release, 26 March 2026. ↩
- Polymarket (2026). Resolution. Documentation. ↩
- The Block (2025). Polymarket says governance attack by UMA whale to hijack a bet’s resolution is “unprecedented”. 26 March 2025. ↩
- DL News (2025). Polymarket bettors clash over Zelenskyy suit dispute. 30 June 2025. ↩
- Bloomberg (2026). Las disputas en Polymarket exponen el lado oscuro de los mercados de predicción. Via Bloomberg Línea, 29 May 2026. ↩
- UMA (2025). Managed proposers: an update. Blog, 8 November 2025. ↩
- The Block (2026). Polymarket rolls out V2 upgrade. 6 October 2026. ↩
- Sirolly, A., Ma, H., Kanoria, Y., & Sethi, R. (2025). Network-based detection of wash trading. SSRN Working Paper 5714122. ↩
- Paradigm (2025). Polymarket volume is being double-counted. 8 December 2025. ↩
- Akey, P., Grégoire, V., Harvie, N., & Martineau, C. (2026). Who wins and who loses in prediction markets? Evidence from Polymarket. CEPR Discussion Paper 21615. ↩