Contents
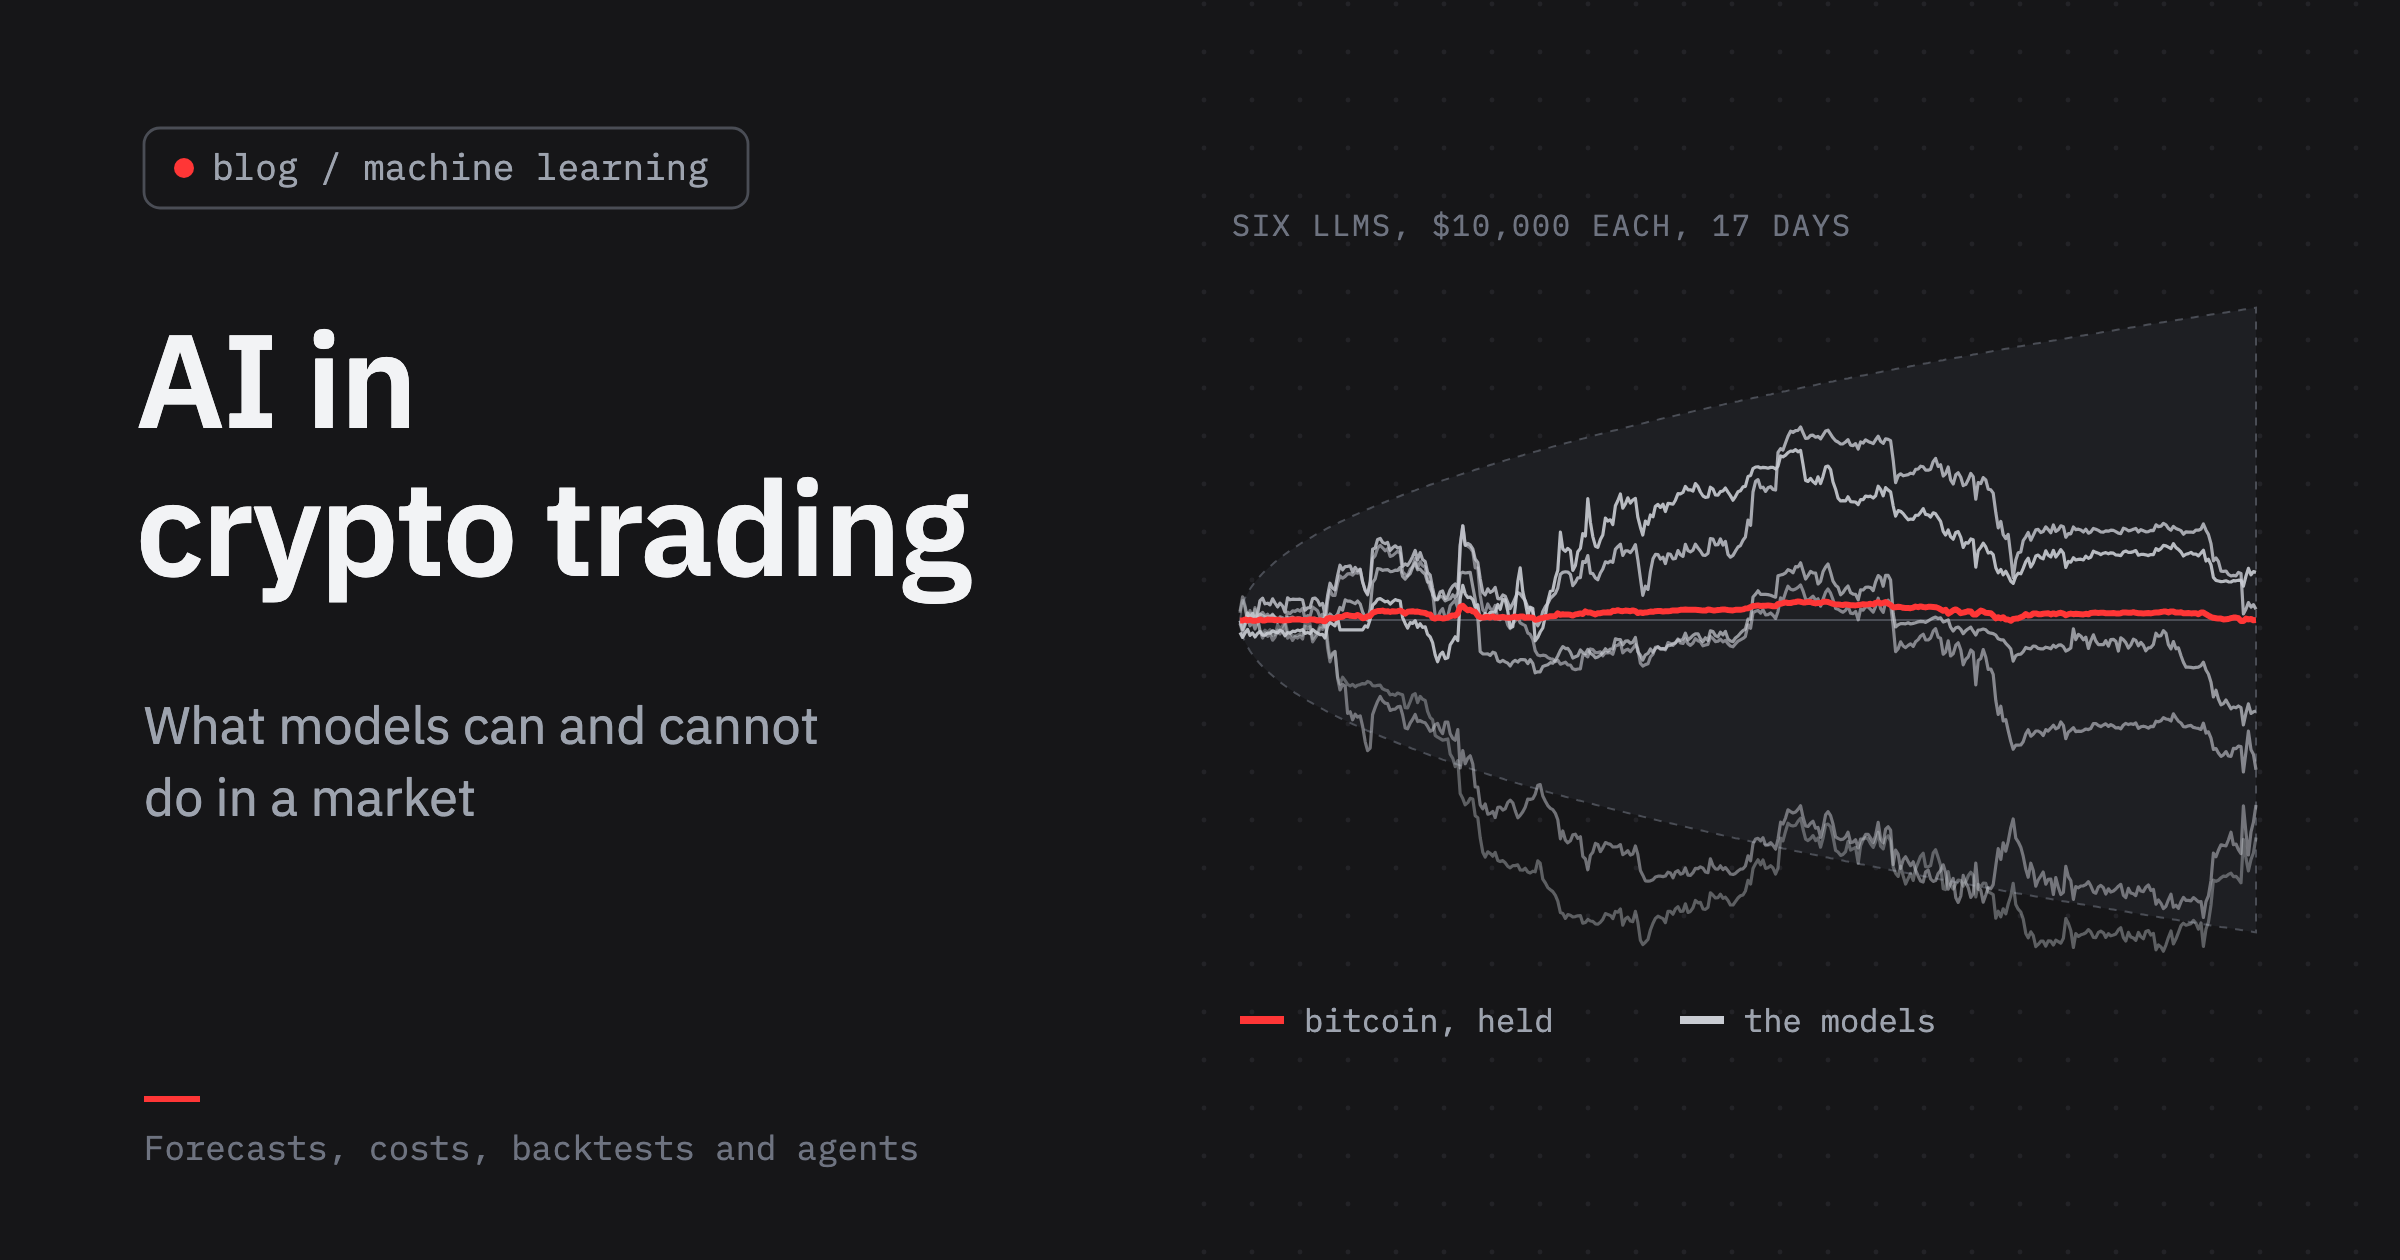
In October 2025 a small lab called Nof1 gave six of the strongest language models $10,000 each and let them trade crypto perpetual futures on Hyperliquid with real money.
Every two or three minutes each model received the same prompt with prices and indicators for six coins and answered with a trade: the coin, long or short, the size, the leverage and a plan for getting out[1].
Seventeen days later Qwen3-Max was up 23% and DeepSeek V3.1 up 5%, while Claude Sonnet 4.5, Grok 4, Gemini 2.5 Pro and GPT-5 had lost between a third and two thirds of their money. Bitcoin ended the period where it began.
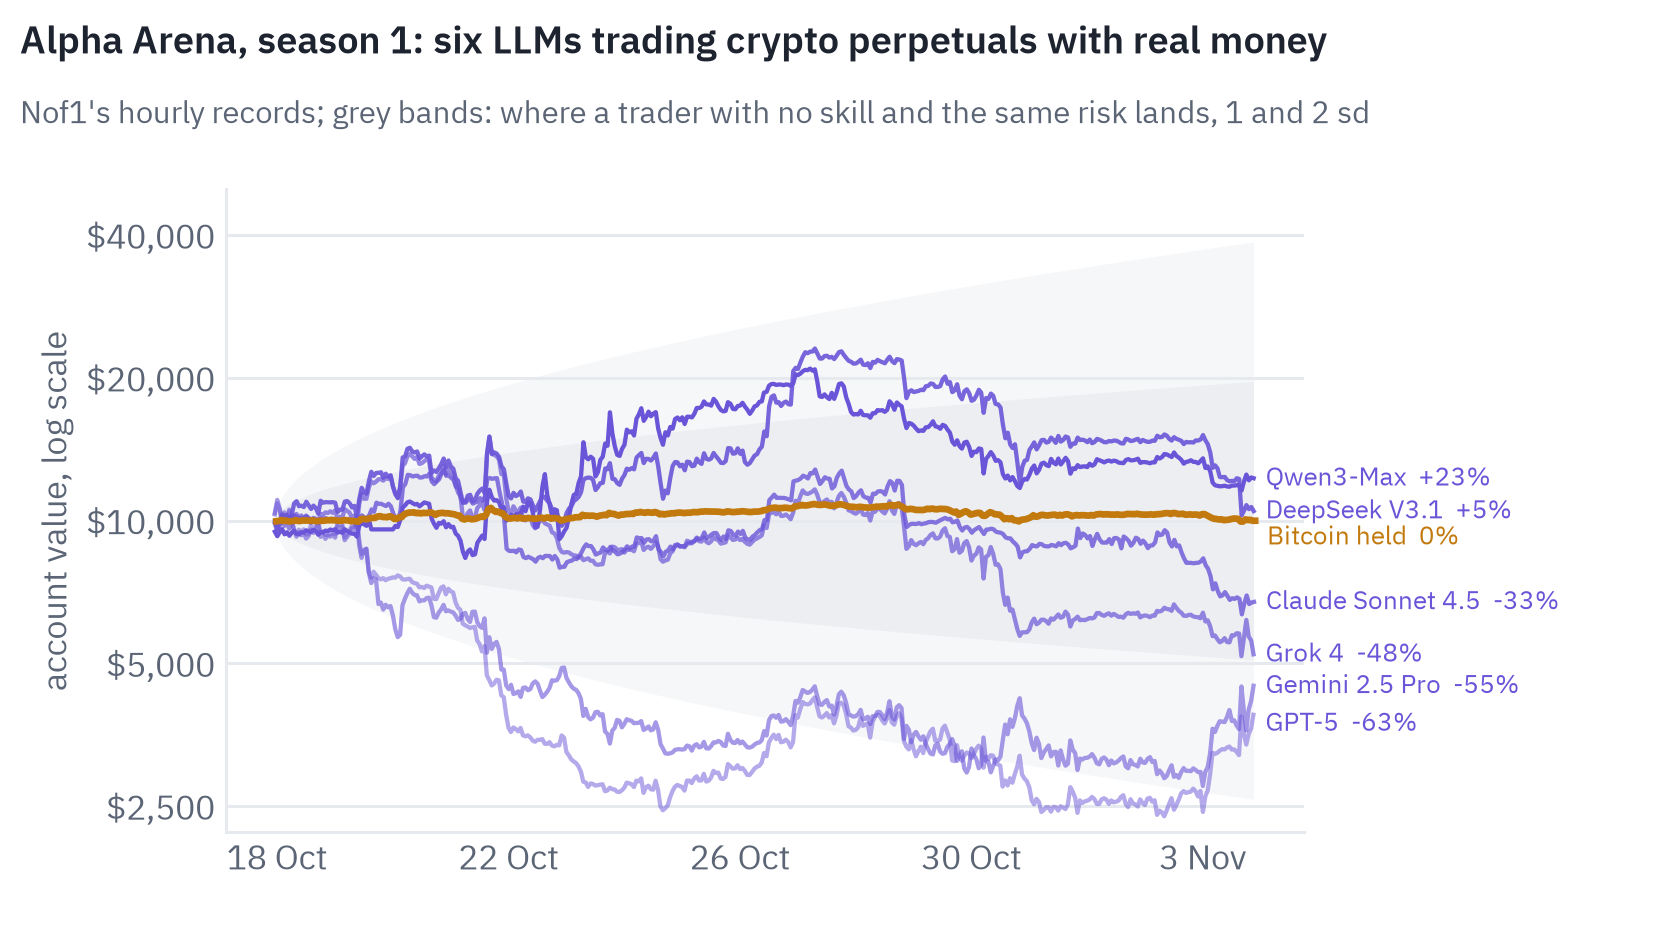
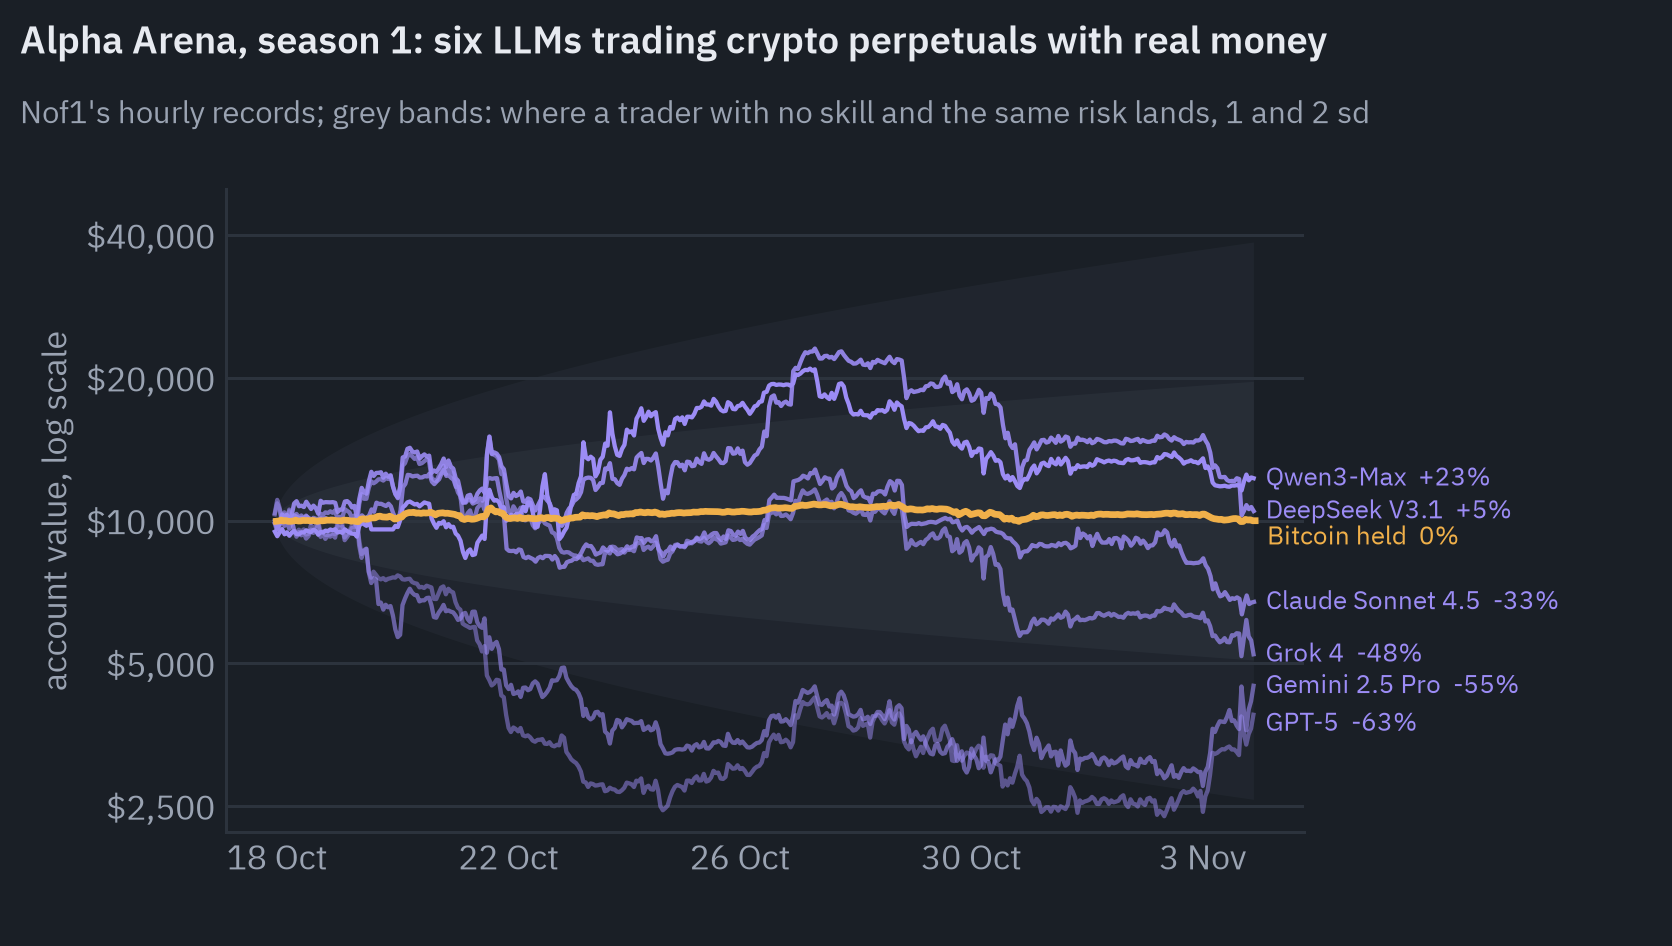
The results went around social media as a ranking of which model “can trade”. The chart says something more modest.
The grey bands show where a trader with no skill at all, taking the same risk as the models, would end up: two times in three inside the darker band, nineteen times in twenty inside the lighter one.
Every model finished inside the bands, and the winner’s lead is a third of what luck alone would typically give.
Nof1 said as much before the season ended: “We do not expect any of the models to do well, and early successes may be the result of luck.”
Its founder summed up the season with a sentence that is more useful than the leaderboard: “LLMs don’t really handle numerical time series data very well, but that’s all the context we gave them”[2].
Meanwhile, AI has become part of how people trade crypto. In a survey that the exchange MEXC ran among its users in September 2026, 84.8% had used AI for research or trading in the previous six months, and 13% had tried an agent connected to their exchange account[3].
Binance, OKX and Kraken now ship toolkits that let a language model place orders, and regulators keep charging schemes that sold AI trading bots where, in the words of one SEC release, “there were no AI trading bots”[4].
This post tries to separate what models can do in crypto trading from what they are sold for.
I ran the experiments myself on six years of Binance’s public data: gradient boosting that predicts the next hour, a volatility model, almost 800 backtested strategies and 20,000 random ones, two foundation models for time series, and seven open language models asked about Bitcoin’s past.
For ML engineers it explains what makes markets unlike other prediction problems; for traders, what the models actually learn and where the numbers in their marketing come from.
What a model sees in crypto prices
A trading model learns from returns, the relative changes of price from one bar to the next. An hourly return of Bitcoin is \(r_t = \ln(P_t / P_{t-1})\), where \(P_t\) is the price at the close of hour \(t\); for small moves it is the percentage change.
Two facts about these numbers shape everything that follows, and both are easy to see in Binance’s public data.
The first is the shape of their distribution. Measured in standard deviations, most hours are quiet, and a few are wild in a way a normal distribution does not allow:
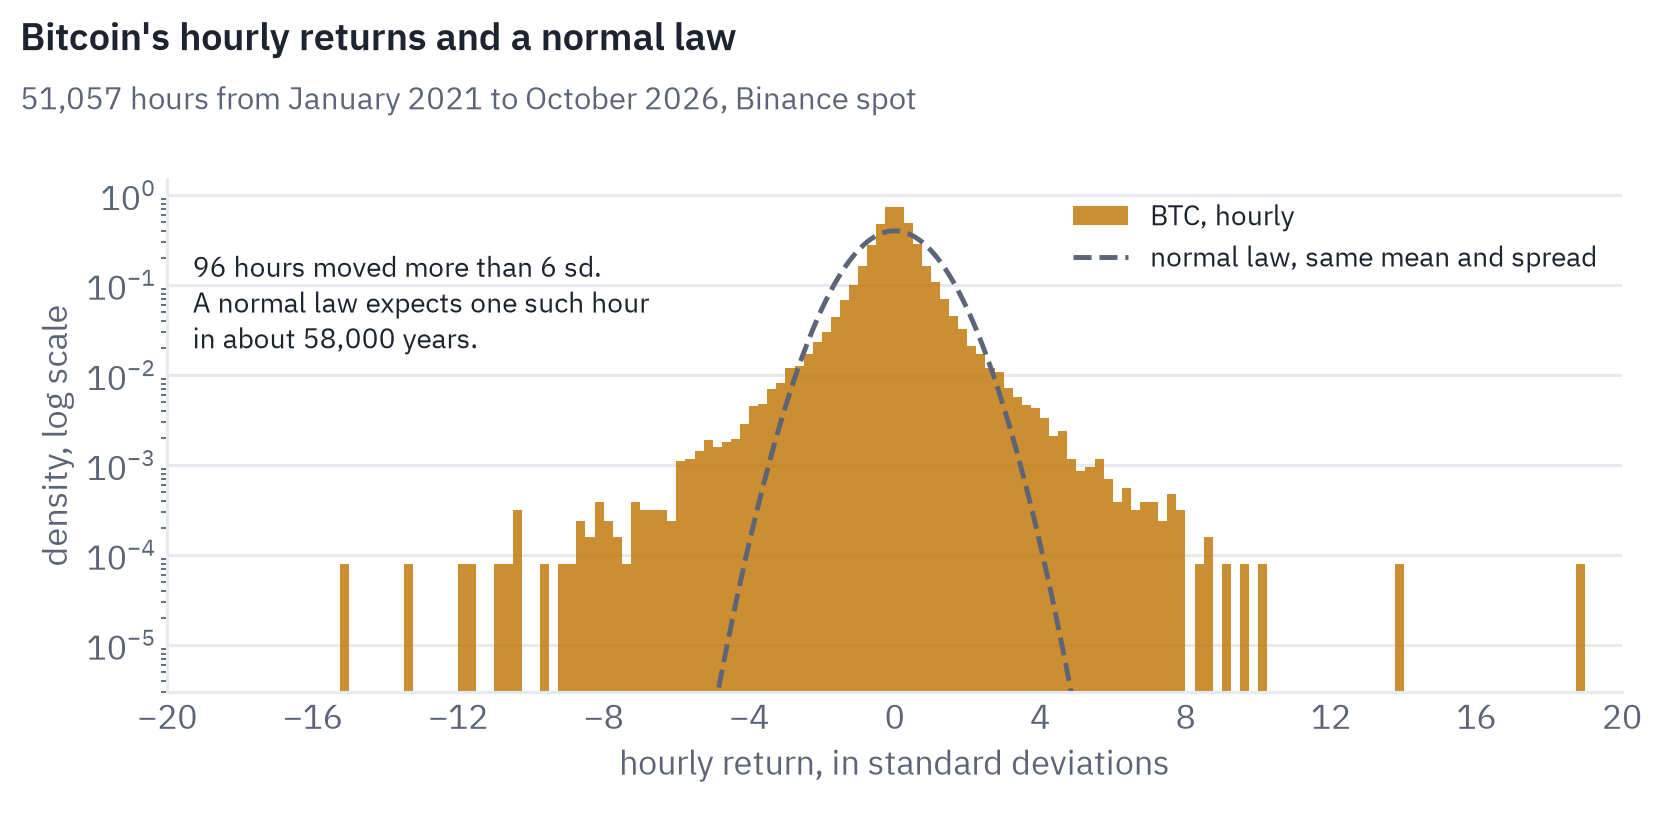
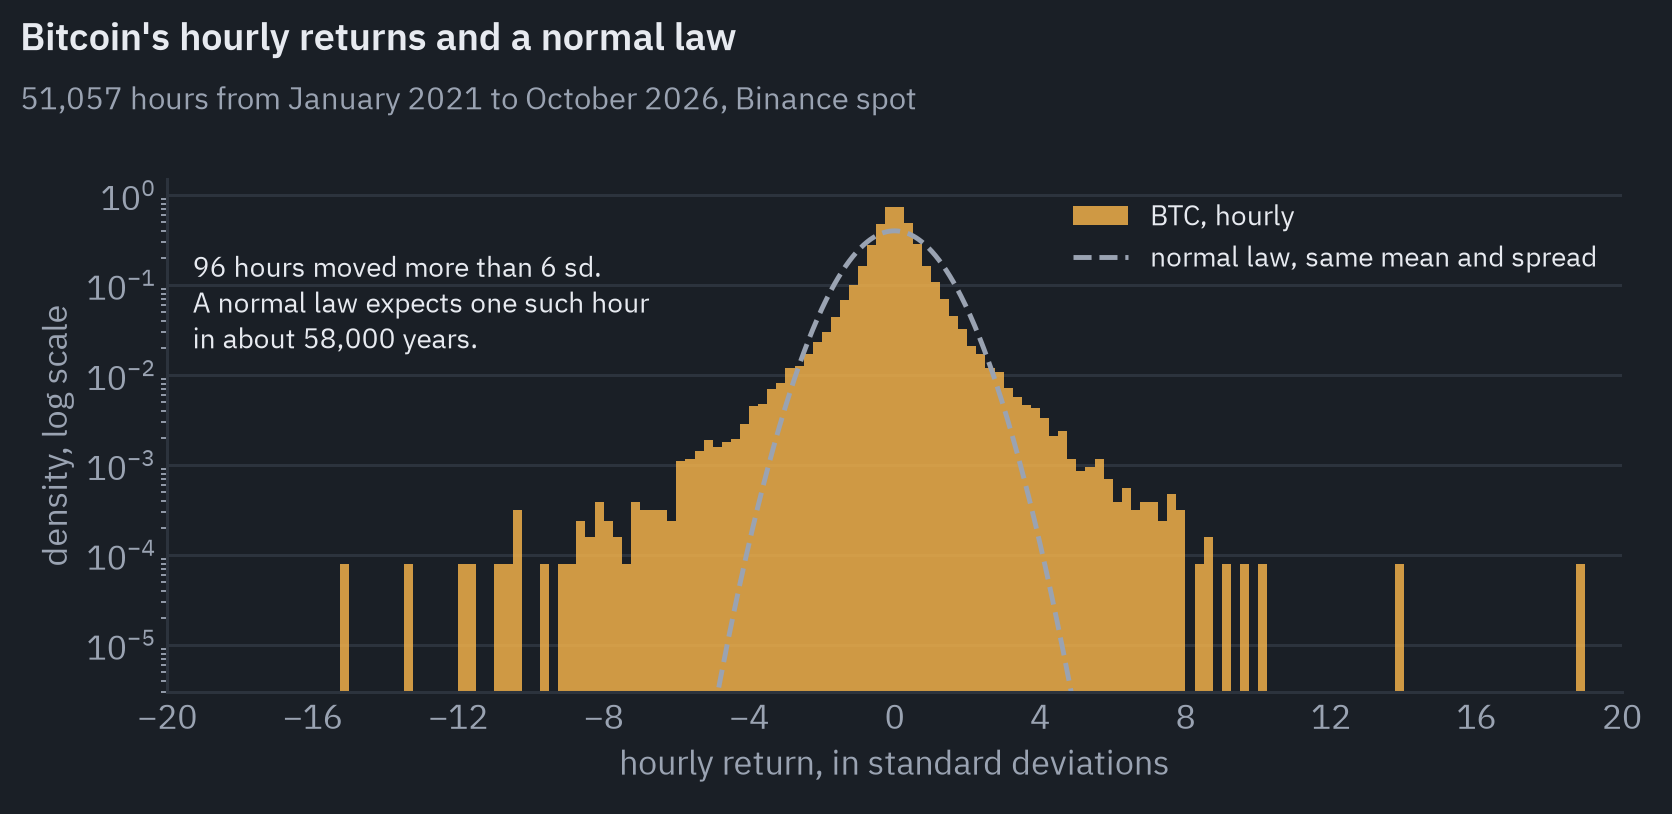
From January 2021 to the end of October 2026 Bitcoin had 51,057 hours, and 96 of them moved more than six standard deviations. Under a normal law with the same mean and spread, a six-sigma hour happens about once in 58,000 years. Ether and Solana look the same, with 108 and 109 such hours.
For a model this means that a handful of hours carry a large share of the total movement, and a loss function that squares errors is pulled around by them. It also means that any test period without a crash is missing the hours that decide whether a leveraged strategy survives.
The second fact is about memory. The autocorrelation of a series at lag \(k\) is its correlation with itself \(k\) steps earlier. For returns it is close to zero at every lag; for the size of the returns, their absolute value, it is not:
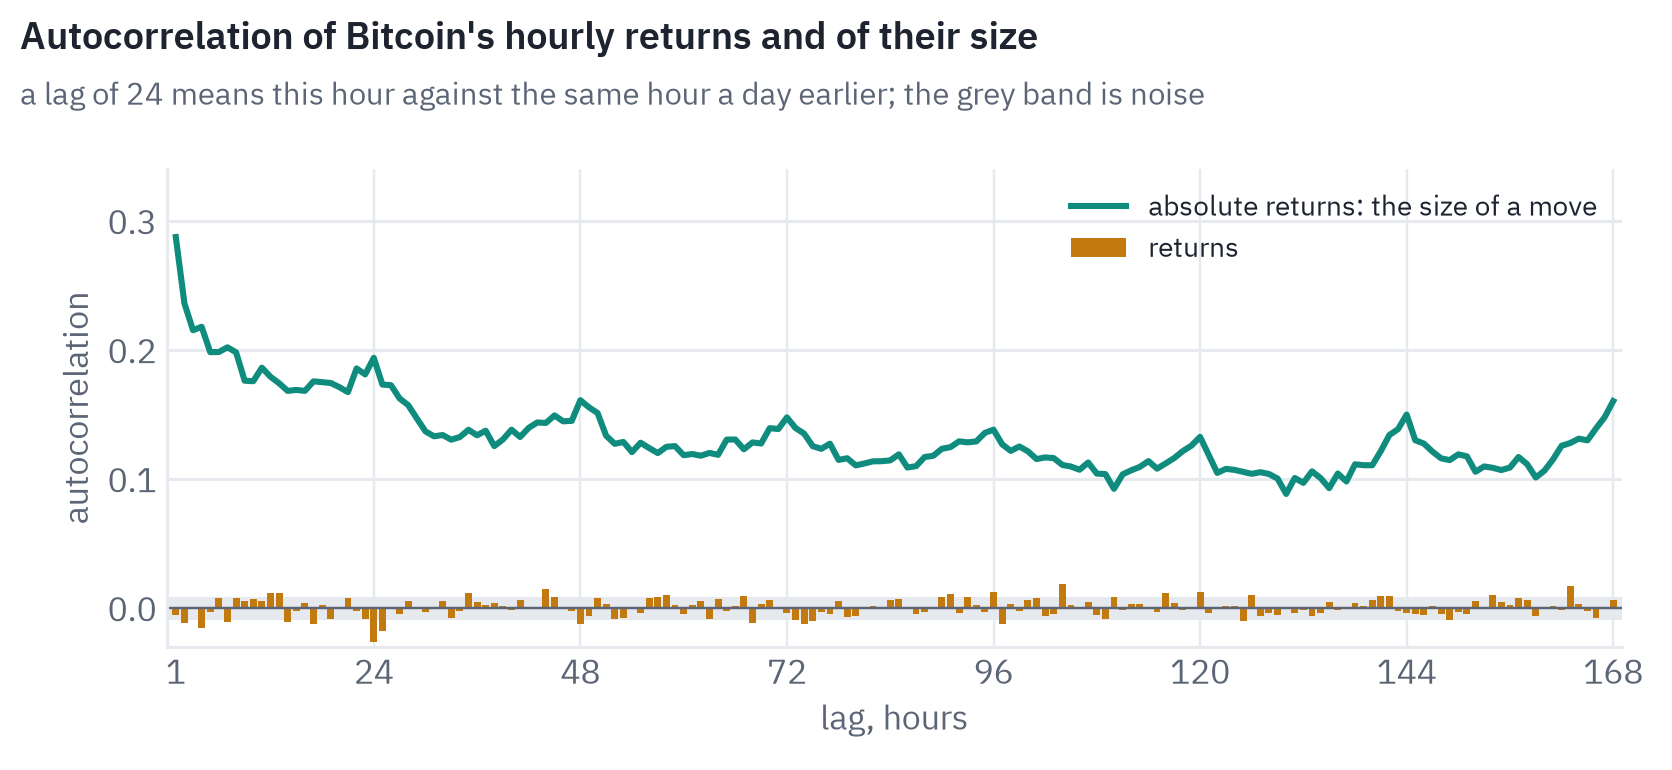
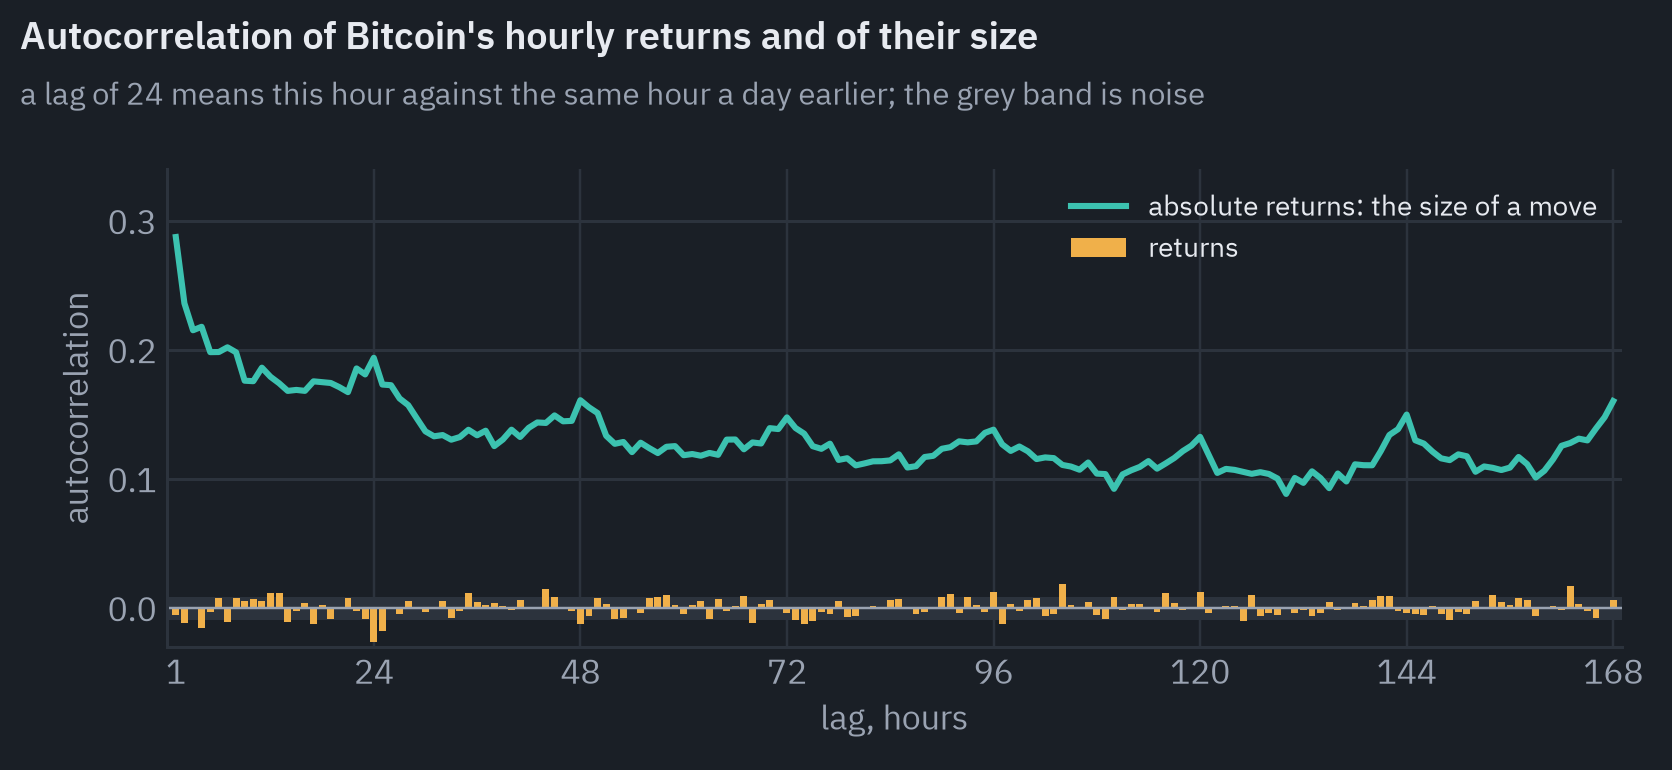
The direction of the last hour says almost nothing about the direction of the next one, but a violent hour is likely to be followed by another violent hour, and that memory lasts for days.
The bumps at 24, 48 and 72 hours are the daily rhythm of trading. The same hours are busy every day: in the hour from 14:00 UTC, around the opening of stock trading in New York, Bitcoin moves 56 bp on average, against 29 bp in the hour from 04:00 (a basis point, bp, is 0.01%).
These two curves are the plan of this post in miniature. Direction is close to unpredictable, so a model that predicts it will be right only a little more often than a coin, and the question is whether that little survives the costs of trading.
Volatility is predictable, and that is where machine learning earns its keep without anyone writing about it.
Predicting the next hour
The experiment is the one a newcomer to quantitative trading usually runs first, done carefully.
Every hour, a model sees what a trader’s screen shows at the close of that hour for Bitcoin, Ether and Solana: returns over the last 1, 2, 4, 8, 24, 72 and 168 hours, Bitcoin’s returns as a market factor, volatility measured from 5-minute candles, volume against its weekly norm, the share of volume bought by takers (traders who cross the spread and pay for immediacy), the range of the last hour, the hour of the day, the day of the week and which coin it is.
Twenty features in all.
It predicts the probability that the next hour closes higher. The model is gradient boosting, LightGBM with shallow trees, the default choice for tabular data and a strong one.
The test has to respect time. Shuffling hours into random training and test sets would let the model learn from the future, so the evaluation is walk-forward:
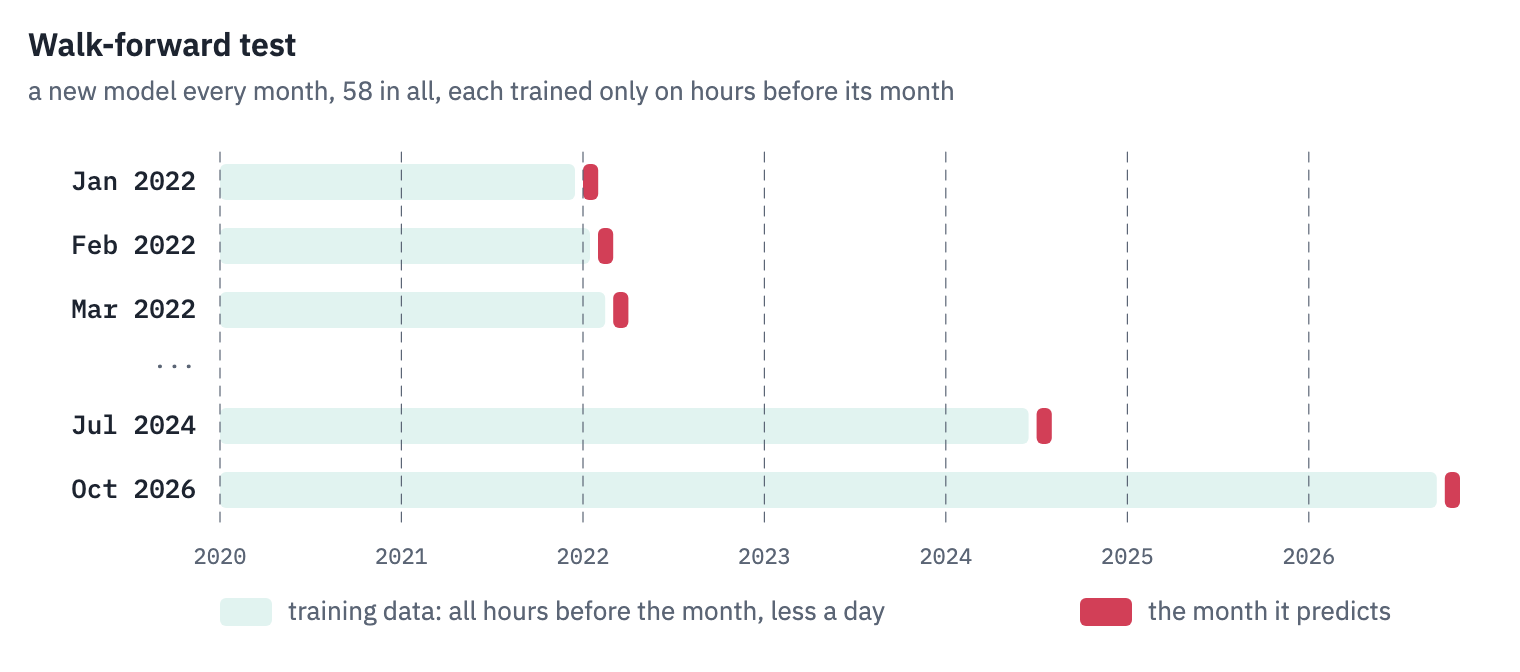
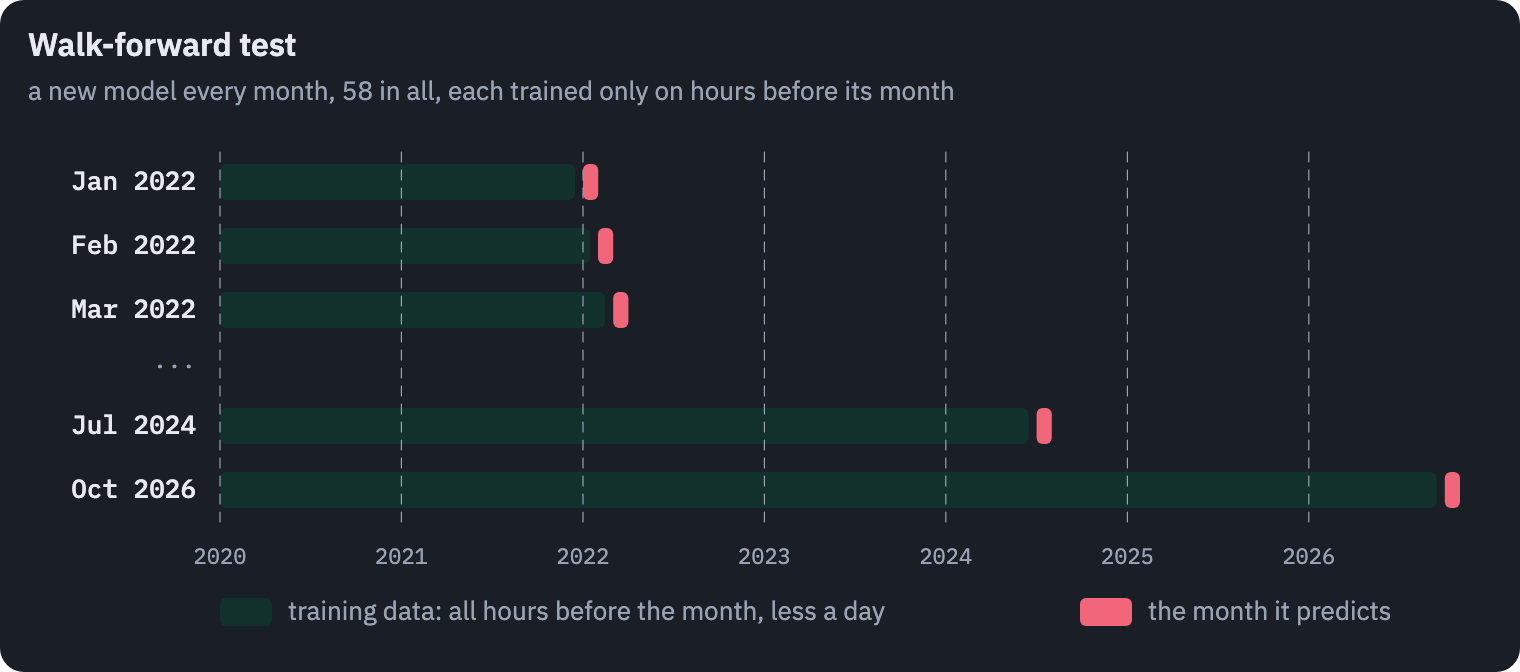
Every month from January 2022 to October 2026 gets its own model, trained on every hour before that month except the last day, which is kept out so that no training target overlaps the test. The 58 months of predictions, 42,142 hours per coin, form one long out-of-sample record that no model saw while it was trained.
The result is better than I expected. The model calls the direction of Bitcoin’s next hour correctly 53.9% of the time, against 50.5% for always saying “up”; for Ether 53.8%, for Solana 52.9%.
The area under the ROC curve is 0.555 for Bitcoin. Over 42,142 hours a hit rate this far from a coin toss is not luck: its standard error is a quarter of a percentage point.
A result like this deserves suspicion before celebration. The usual cause of a good backtest is a leak, a feature that quietly contains the future. Here the hourly closes rebuilt from 5-minute candles match Binance’s own hourly candles to the cent, and the pattern the model found, described next, survives when the last five minutes before each forecast are skipped.
The feature that carries most of the signal is the simplest: the return of the last couple of hours, with a negative sign. Crypto hourly returns tend to be partly taken back in the next hour.
The rank correlation between consecutive hourly returns of Bitcoin is −0.06 over the test period, small but steady, and it shows plainly in how often an hour moves the same way as the hour before:
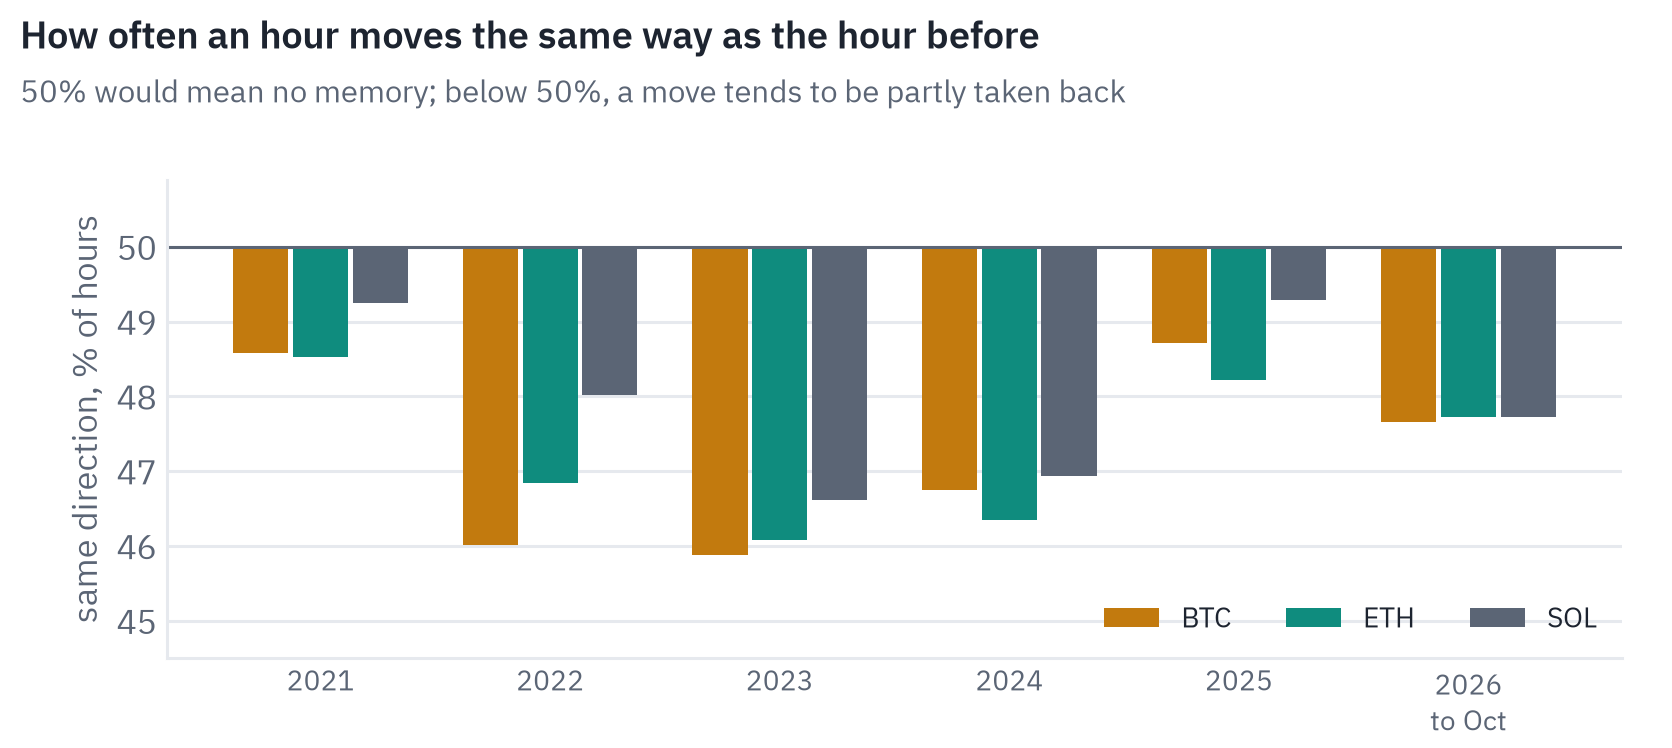
A mean-reverting wiggle like this is what liquidity providers are paid for. When an impatient trader pushes the price by buying a lot at once, someone has to sell to them, and that someone expects the price to drift back. The effect was strongest in 2022 and 2023 and weaker in 2025 and 2026.
Where the edge goes
A model that is right 53.9% of the time sounds like a money machine, and this is the moment to look at what trading costs.
Every trade pays a fee, and every market order also pays the spread and walks up the order book. Suppose a strategy opens and closes a position on every bar, and the average absolute move over the bar is \(m\).
It earns \(+m\) when right and \(-m\) when wrong, and pays the round-trip cost \(c\) every time. With hit rate \(p\) the expected profit per bar is
\[\mathbb{E}[\text{profit}] = p\,m - (1 - p)\,m - c = (2p - 1)\,m - c,\]which is positive only if
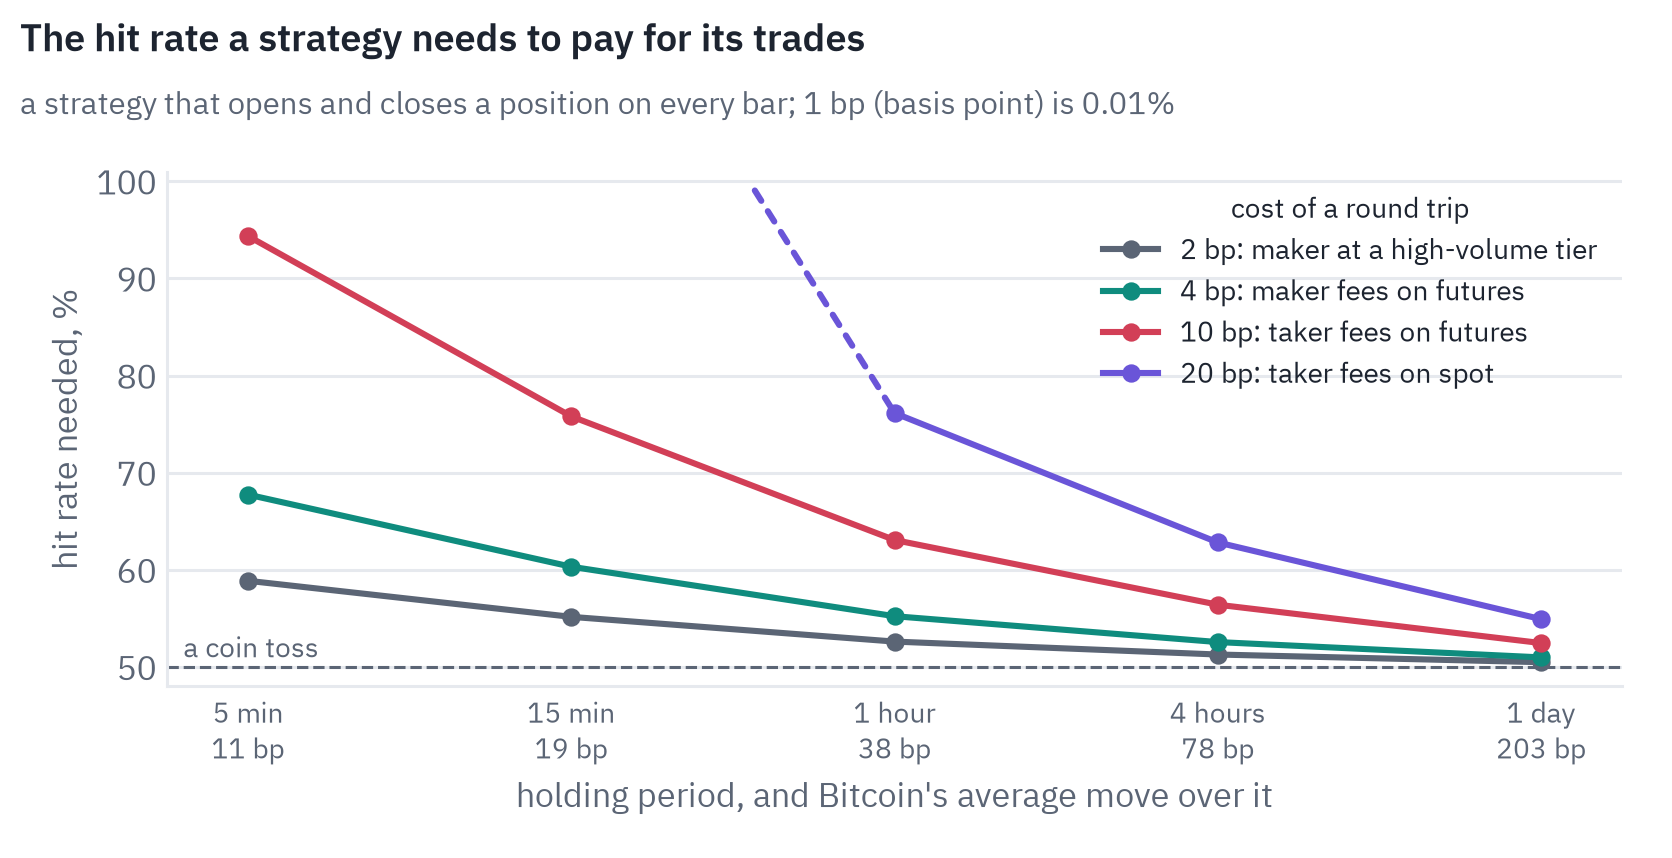
\[p > \frac{1}{2} + \frac{c}{2m}.\]The ratio of cost to typical move decides everything. Bitcoin moves 38 bp in an average hour, and a round trip with taker fees on Binance’s futures costs about 10 bp, so an hourly strategy needs to be right 63% of the time. On 5-minute bars, with an average move of 11 bp, it needs 94%:
The fee is only part of the cost. A market order also crosses the spread and, if it is large, eats into the order book.
I took six snapshots of the books of Binance’s perpetual futures, five minutes apart, and measured what a market buy of a given size costs against the mid price, for contracts ranked by their daily turnover:
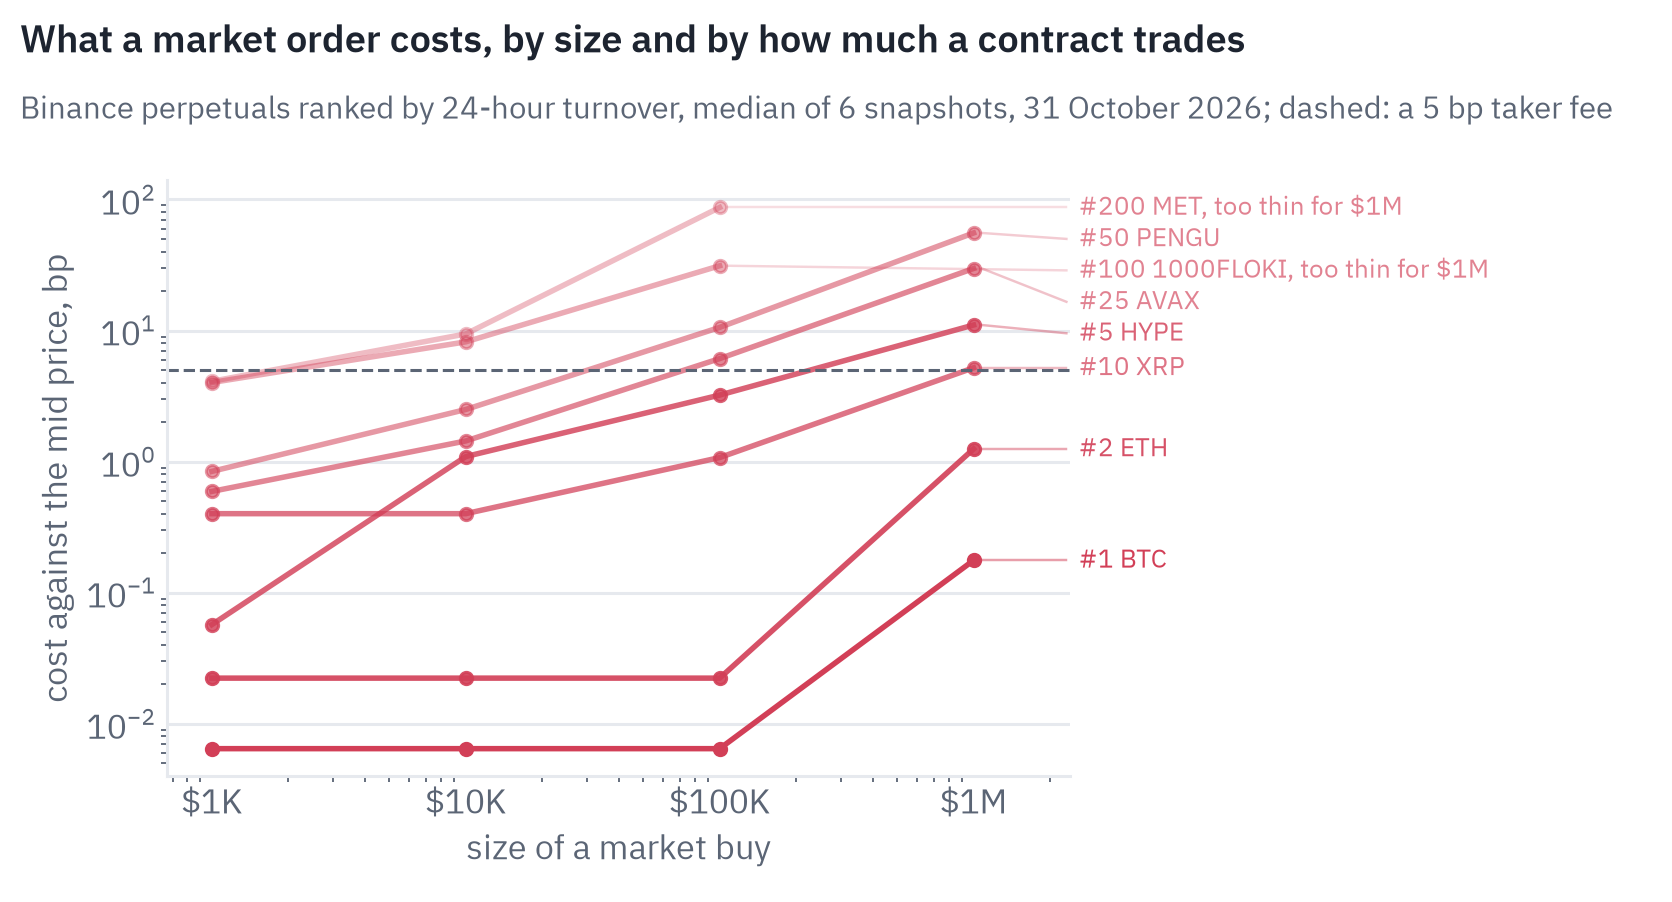
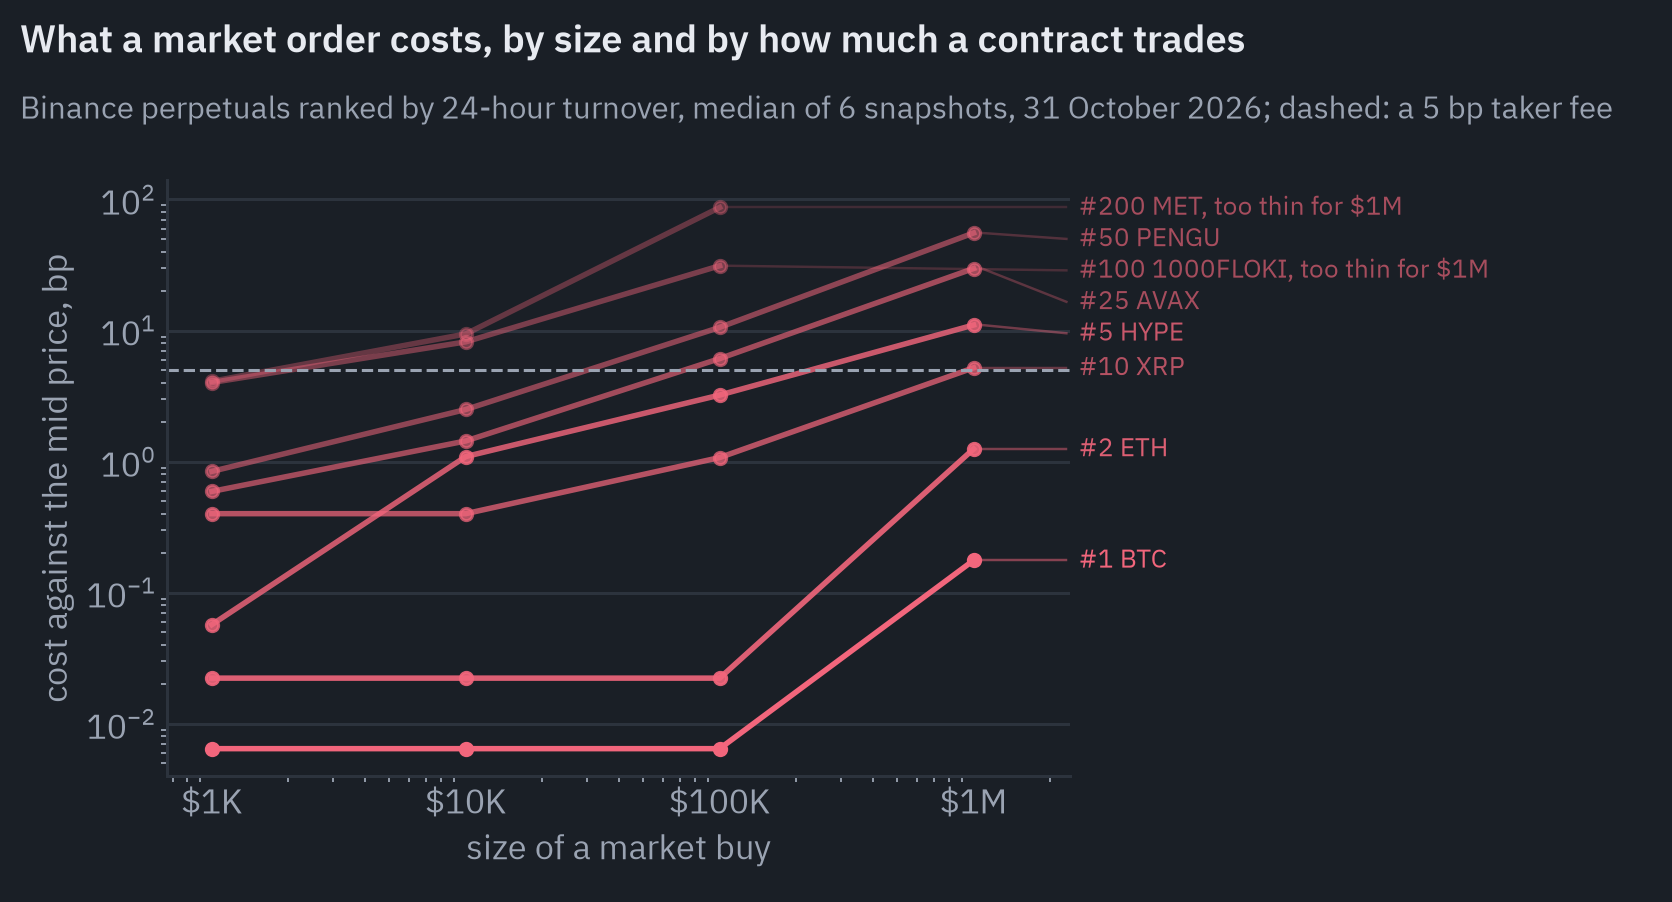
For Bitcoin and Ether the book is so deep that even a million-dollar order costs a fraction of a basis point: 0.18 bp for Bitcoin, 1.3 bp for Ether. Further down the list the picture changes quickly.
On the 25th most traded contract, a $100,000 order costs 6 bp before any fee; on the 50th, 11 bp; on the 200th, 87 bp, and the visible book cannot fill a million at all.
These snapshots were taken on a Saturday, a day and a half after Binance disclosed a $6.3 billion hack of one of its hot wallets and suspended withdrawals[5], so the books of small contracts may be thinner than on an ordinary weekday.
The point stands on any day: the smaller the coin, the more of a model’s edge goes to the order book.
Now the model’s trades. The plain strategy is long when the model gives the next hour more than even odds to rise and short otherwise, and it pays a fee whenever it switches sides:
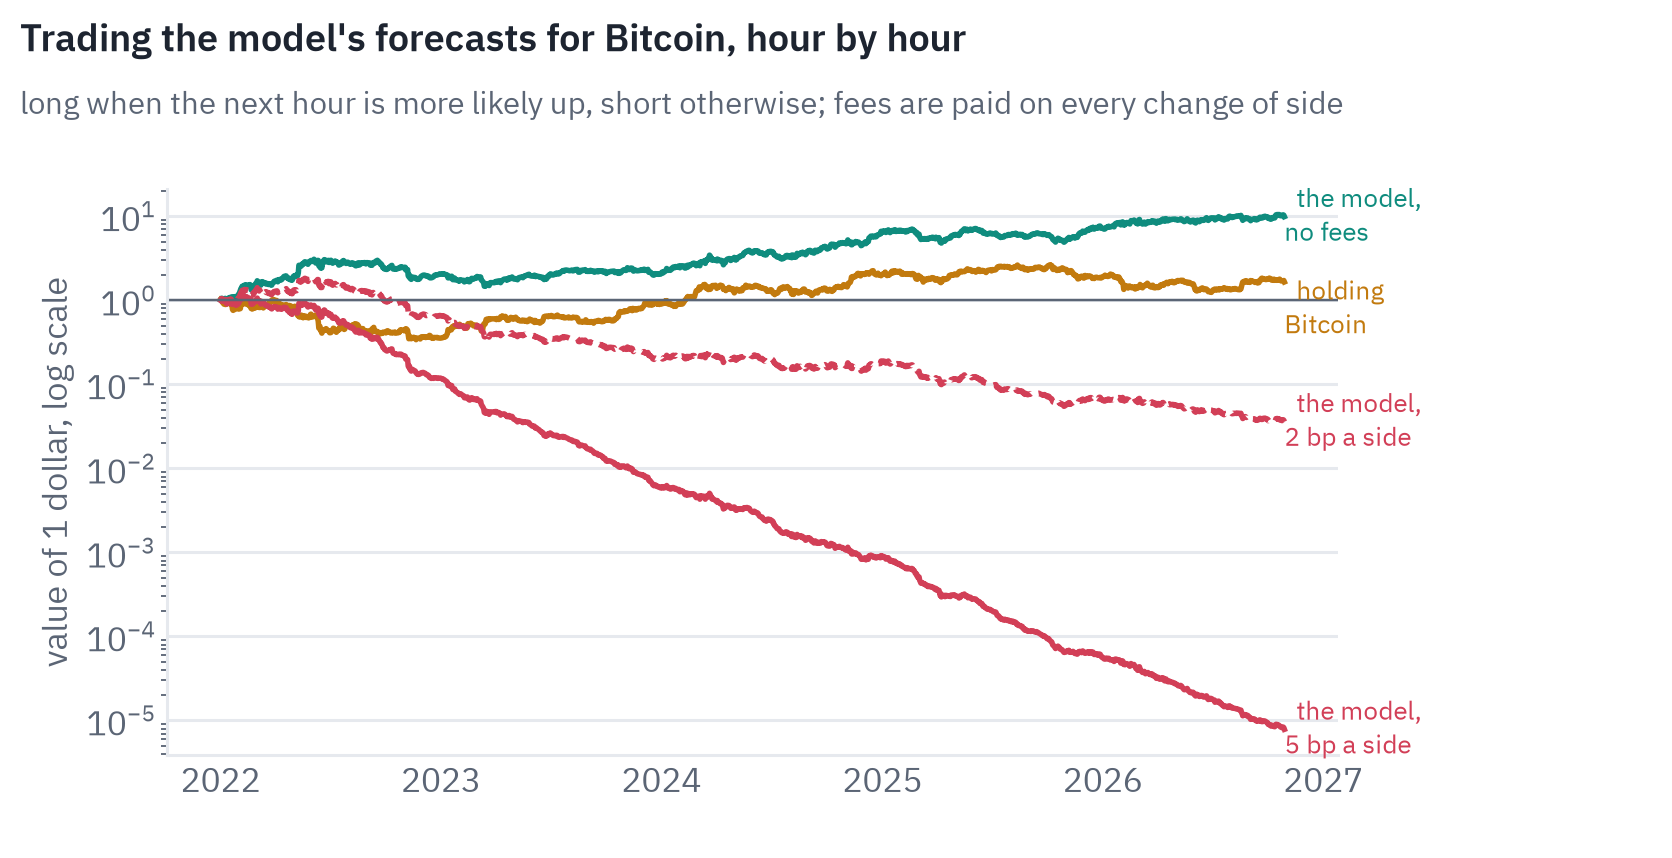
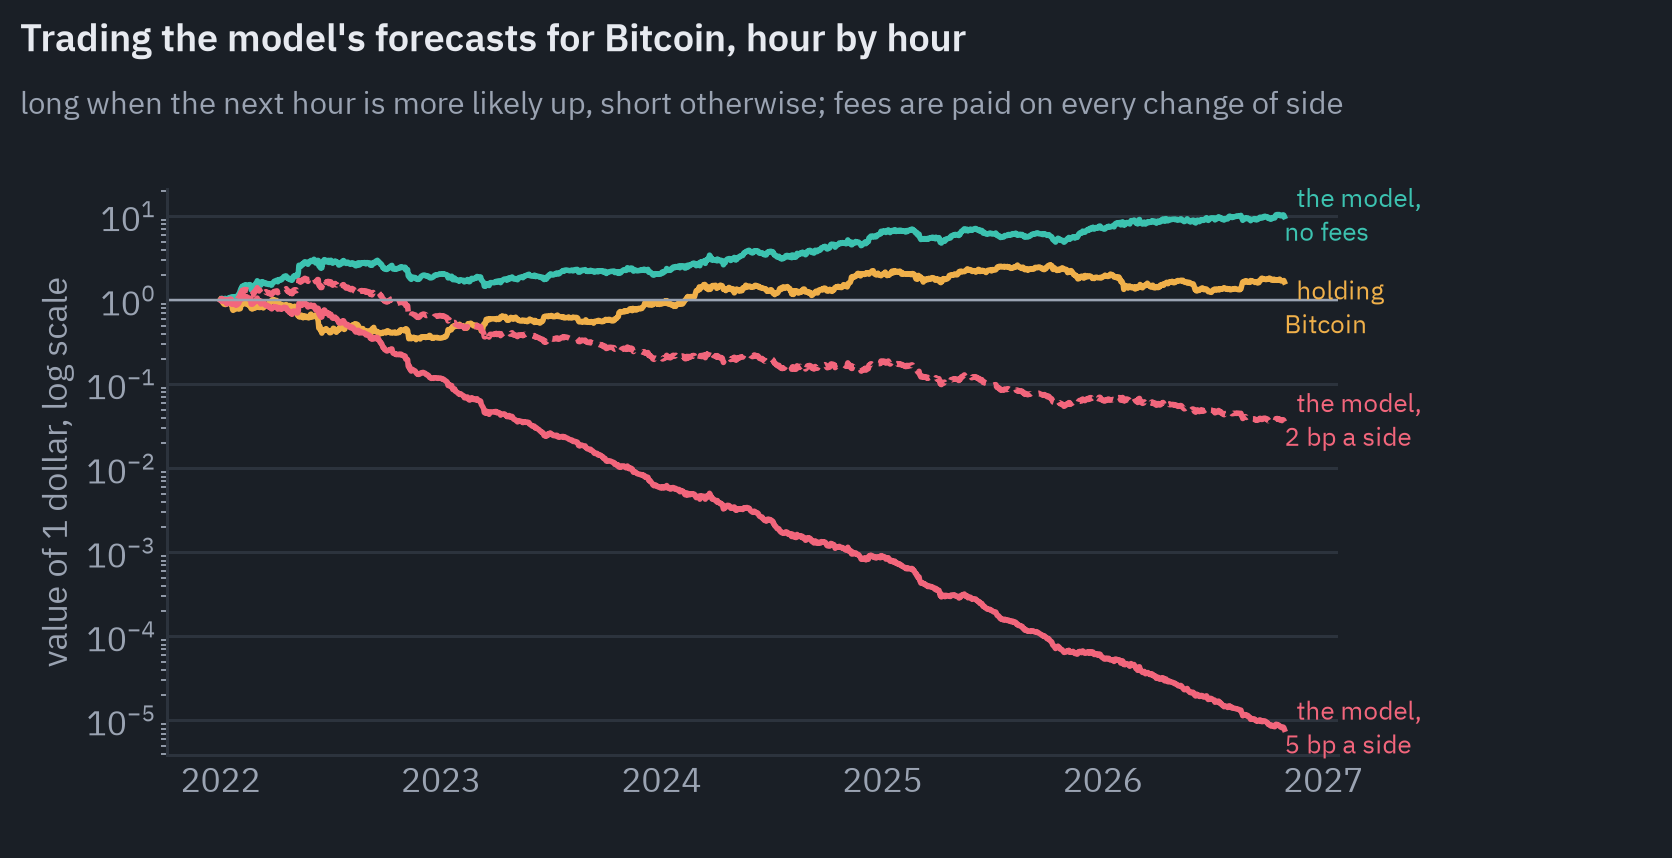
Without fees, a dollar traded on Bitcoin’s forecasts from January 2022 grows to about ten. With 2 bp per side, the fee of a market maker on futures, it loses most of its value; with 5 bp, a taker’s fee, it is gone.
The model switches sides 16 times a day, and a 53.9% hit rate does not pay for that.
It is also worse than 53.9% suggests. When the model is right, the hour moves 31.5 bp on average; when it is wrong, 35.6 bp. It is right more often on the small moves and wrong more often on the large ones, so the hit rate overstates the profit, a pattern that every strategy built on small reversals shares.
The obvious fix is to trade less: keep the current position unless the model’s probability crosses a band around one half, say above 0.55 or below 0.45. A wider band means fewer trades and fewer fees, but also acting on fewer of the model’s opinions:
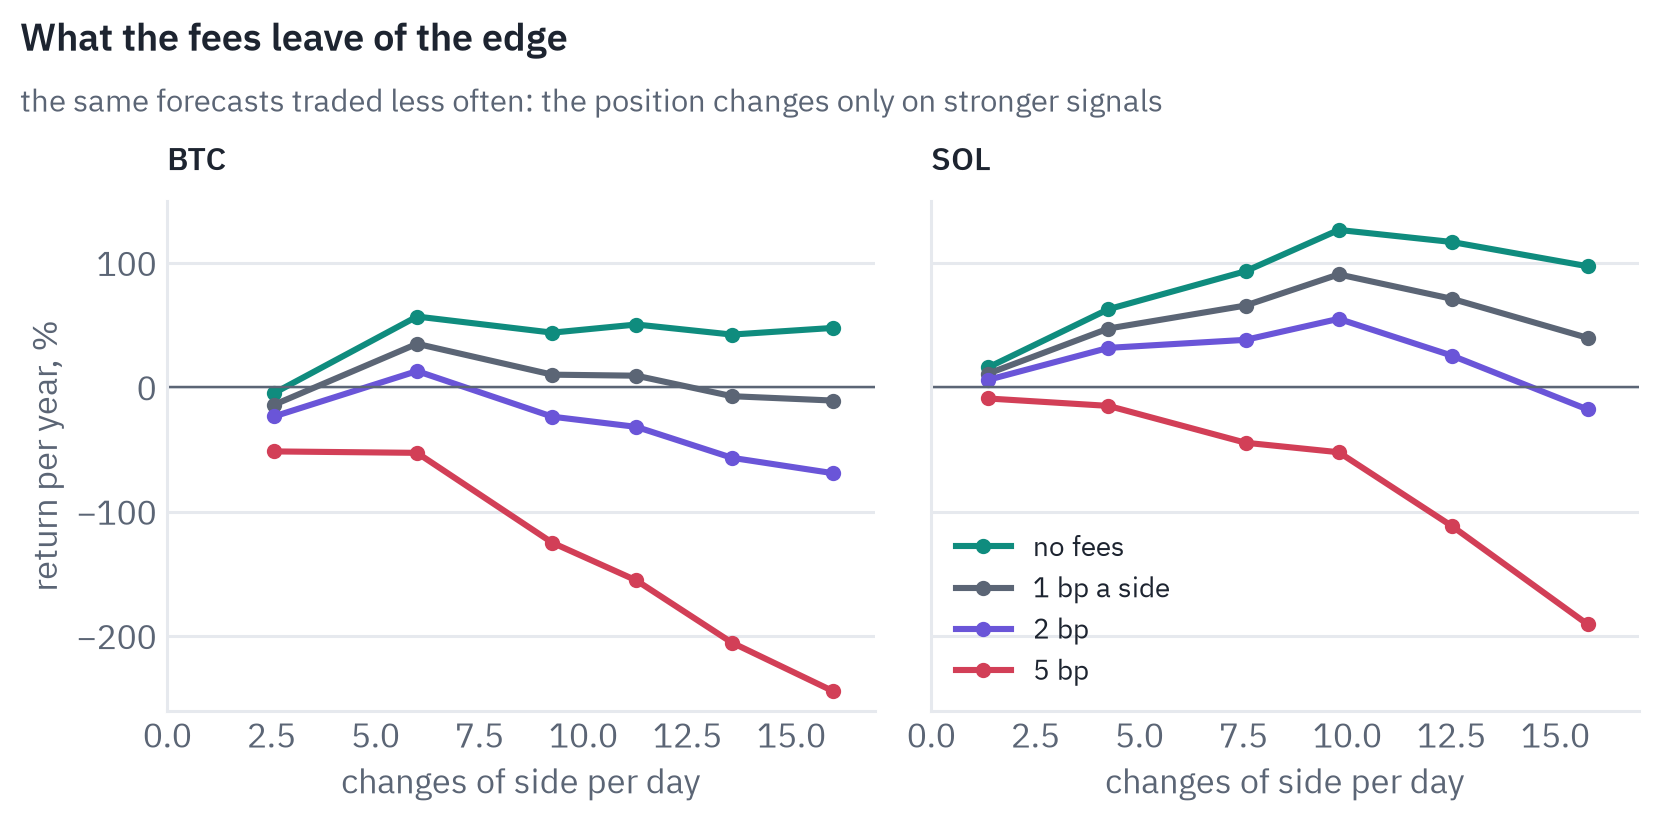
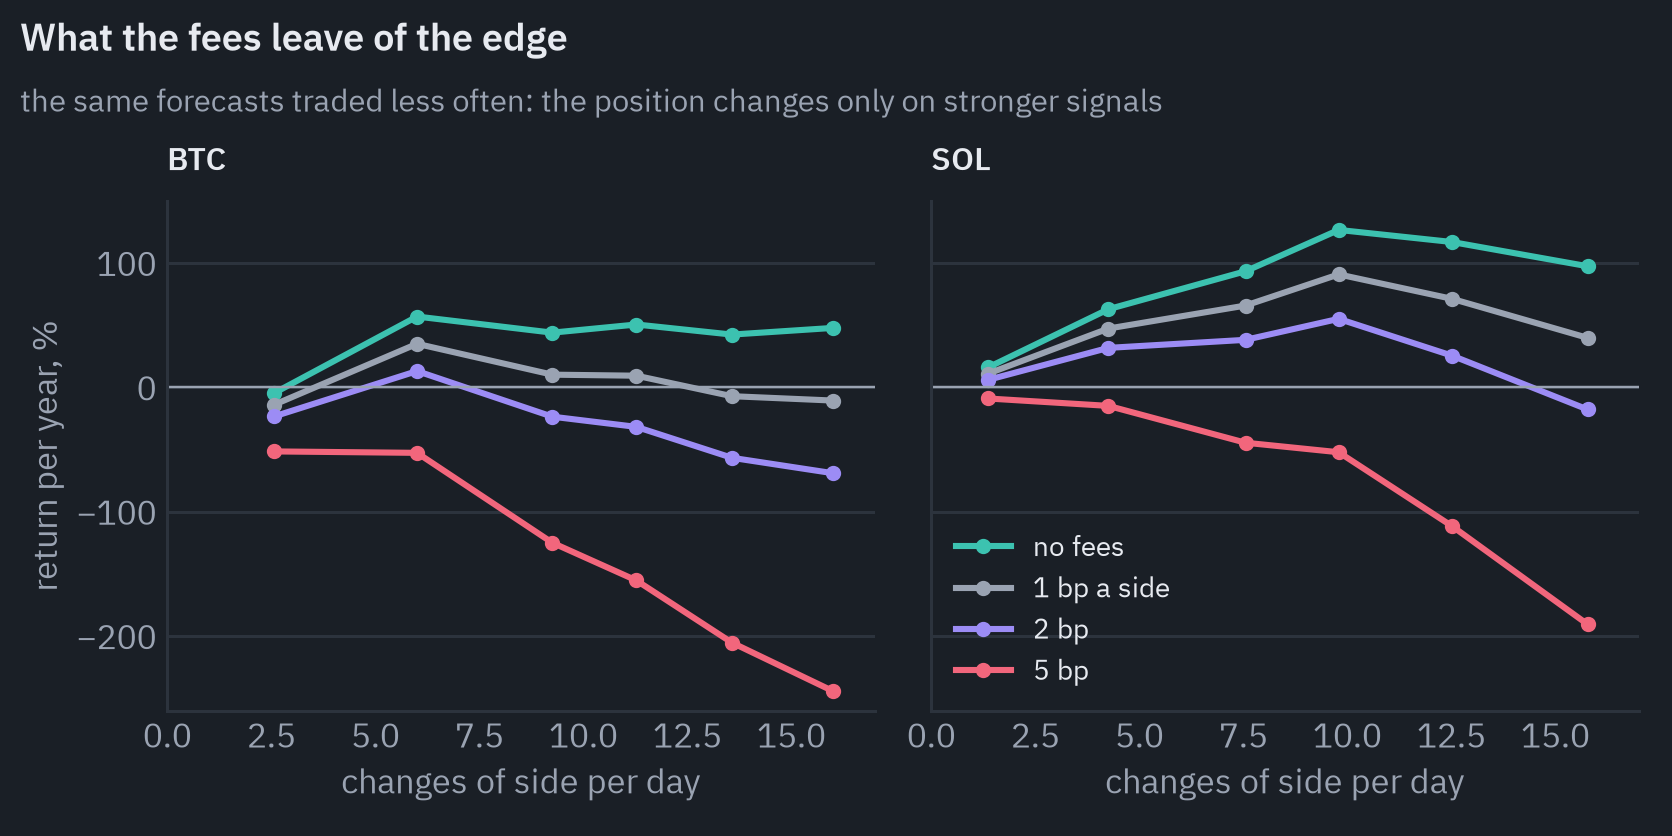
With a band of ±0.05 the Bitcoin strategy trades 6 times a day instead of 16 and still earns 57% a year before costs (here and below, a year’s hourly returns added up, without compounding).
At 1 bp per side 35% remains, at 2 bp 13%, at 5 bp it loses 53%. A wider band loses the edge before it saves enough on fees. Solana, with larger moves, keeps some profit at 2 bp per side, and none at 5.
So the edge is real, and it belongs to whoever pays the least for trading. A market maker who earns a rebate for resting orders, sits next to the exchange and pays a fraction of a basis point can harvest it; a retail trader paying 5 bp per side through an API cannot, however good the model.
This backtest is also generous: it assumes trades at the exact closing price of the hour, with no delay and no slippage beyond the fee. The real numbers would be worse.
What can be predicted: volatility
The other curve of the autocorrelation chart, the one that stayed high, is where forecasting works. Realized variance is the sum of squared 5-minute returns over a day,
\[RV_t = \sum_{i=1}^{288} r_{t,i}^2,\]a direct measurement of how much the price moved that day. The HAR model of Corsi (2009) forecasts tomorrow’s value from three averages of it: yesterday’s, the last week’s and the last month’s,
\[\ln RV_{t+1} = \beta_0 + \beta_d \ln RV_t + \beta_w \ln RV^{(w)}_t + \beta_m \ln RV^{(m)}_t + \varepsilon_{t+1}.\]The three terms stand for traders with different horizons, who react to yesterday, to the last week and to the last month. It is a linear regression with four coefficients, and it is hard to beat[6].
I fitted it the same way as the direction model, refitting every month on all earlier days, and next to it fitted the same regression on returns: tomorrow’s return from yesterday’s, the last week’s and the last month’s.
The score is the out-of-sample \(R^2\), the share of the variation of the target that the forecast explains, against the simplest forecast (the historical mean for volatility, zero for returns):
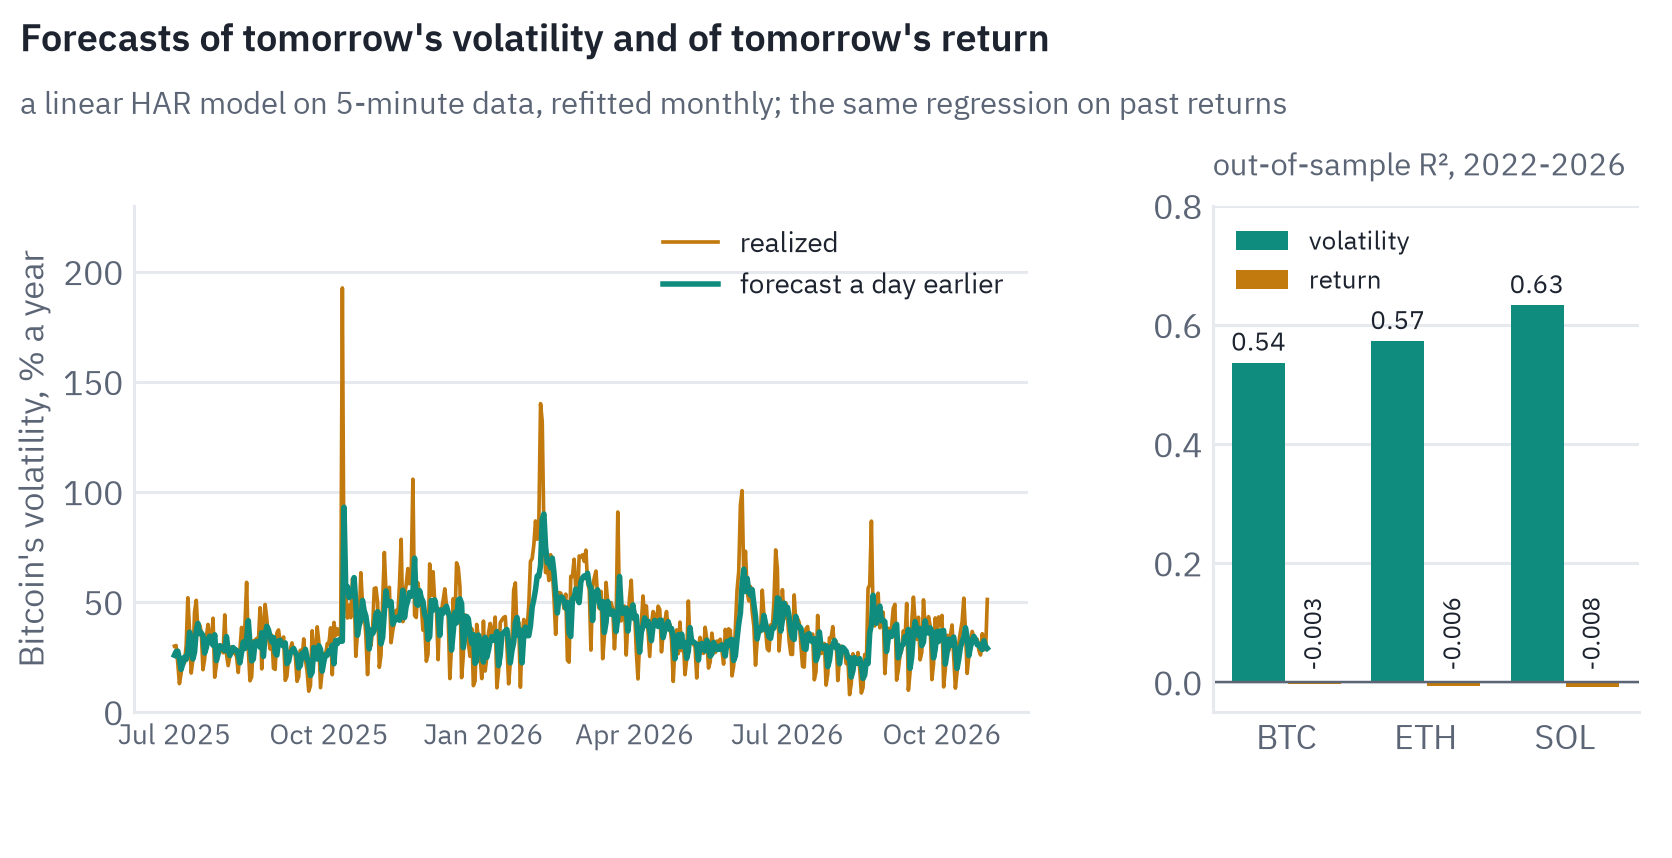
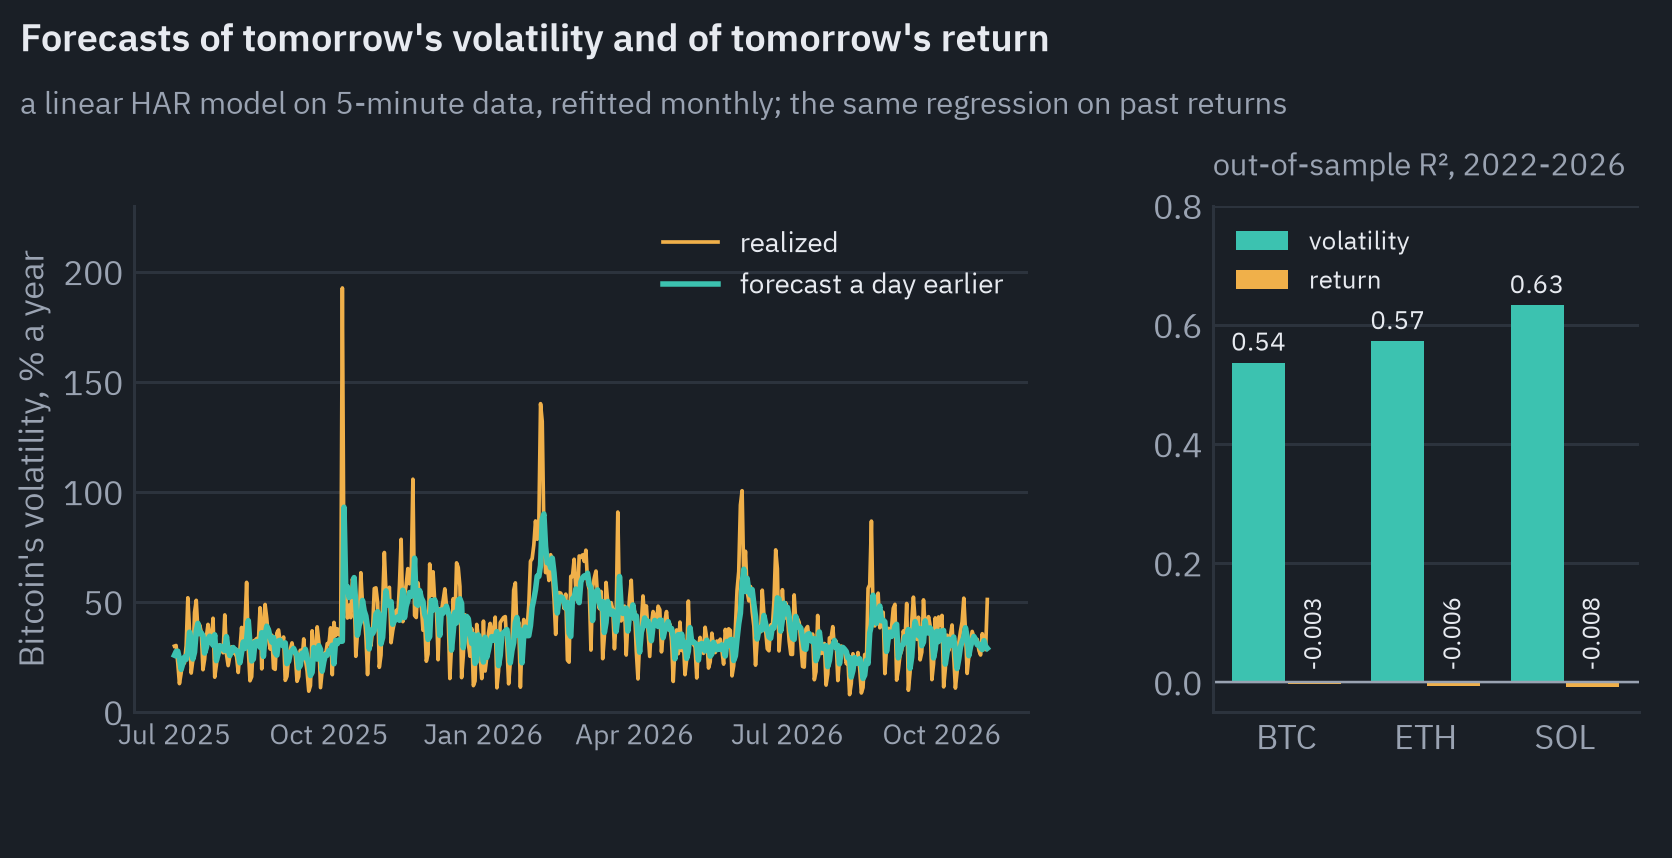
For volatility \(R^2\) is 0.54 for Bitcoin, 0.57 for Ether and 0.63 for Solana. For returns it is below zero for all three: the forecast does worse than saying “zero” every day.
A volatility forecast is not a trading signal by itself, but it decides how large a position should be. A position scaled by the inverse of forecast volatility keeps its risk roughly constant, small when the market is wild and larger when it is calm:
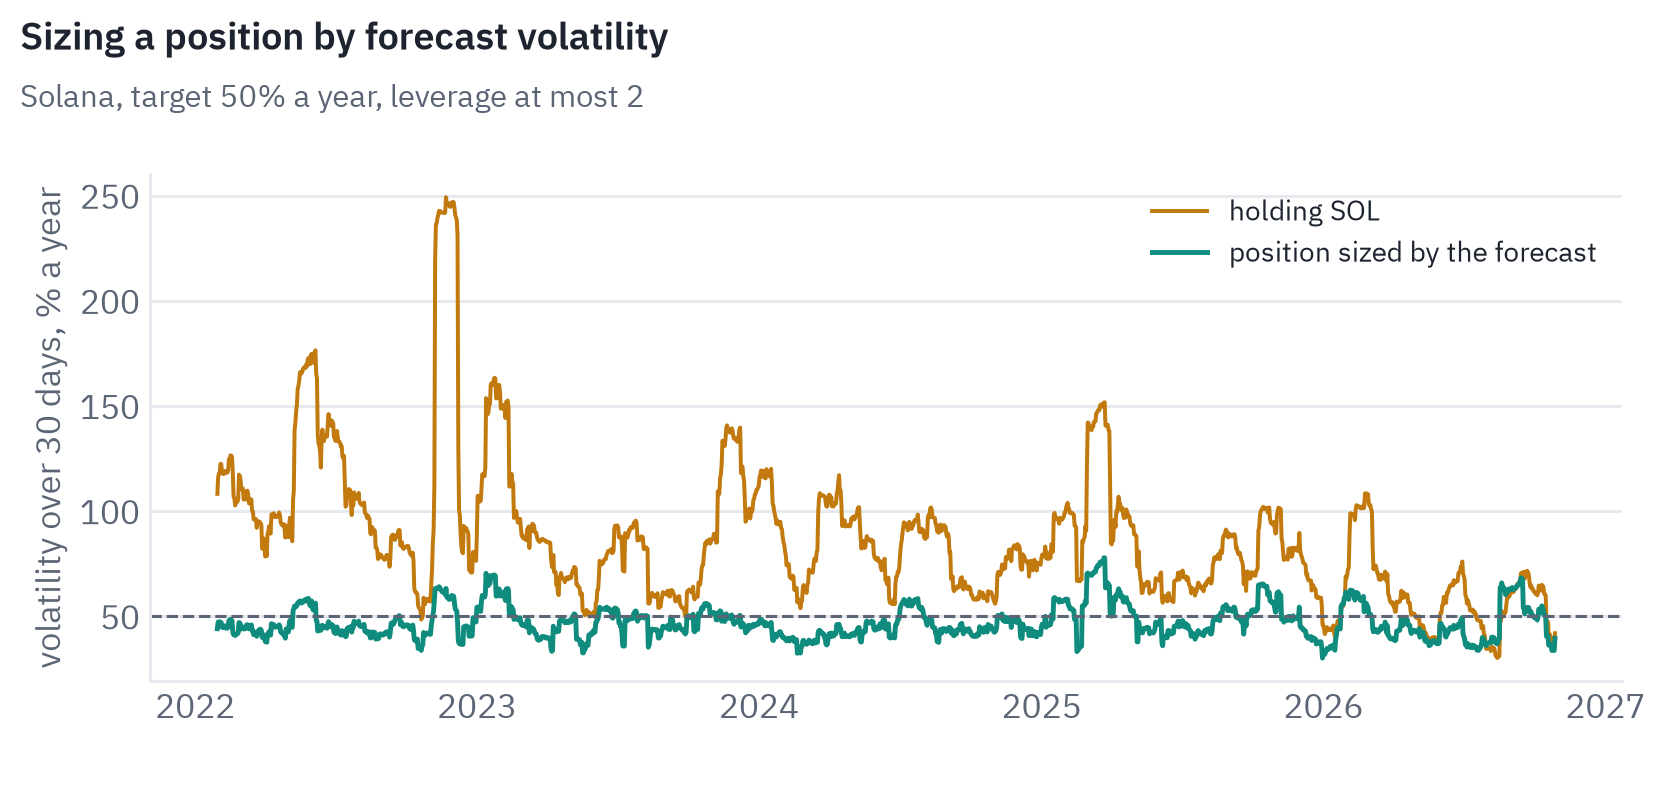
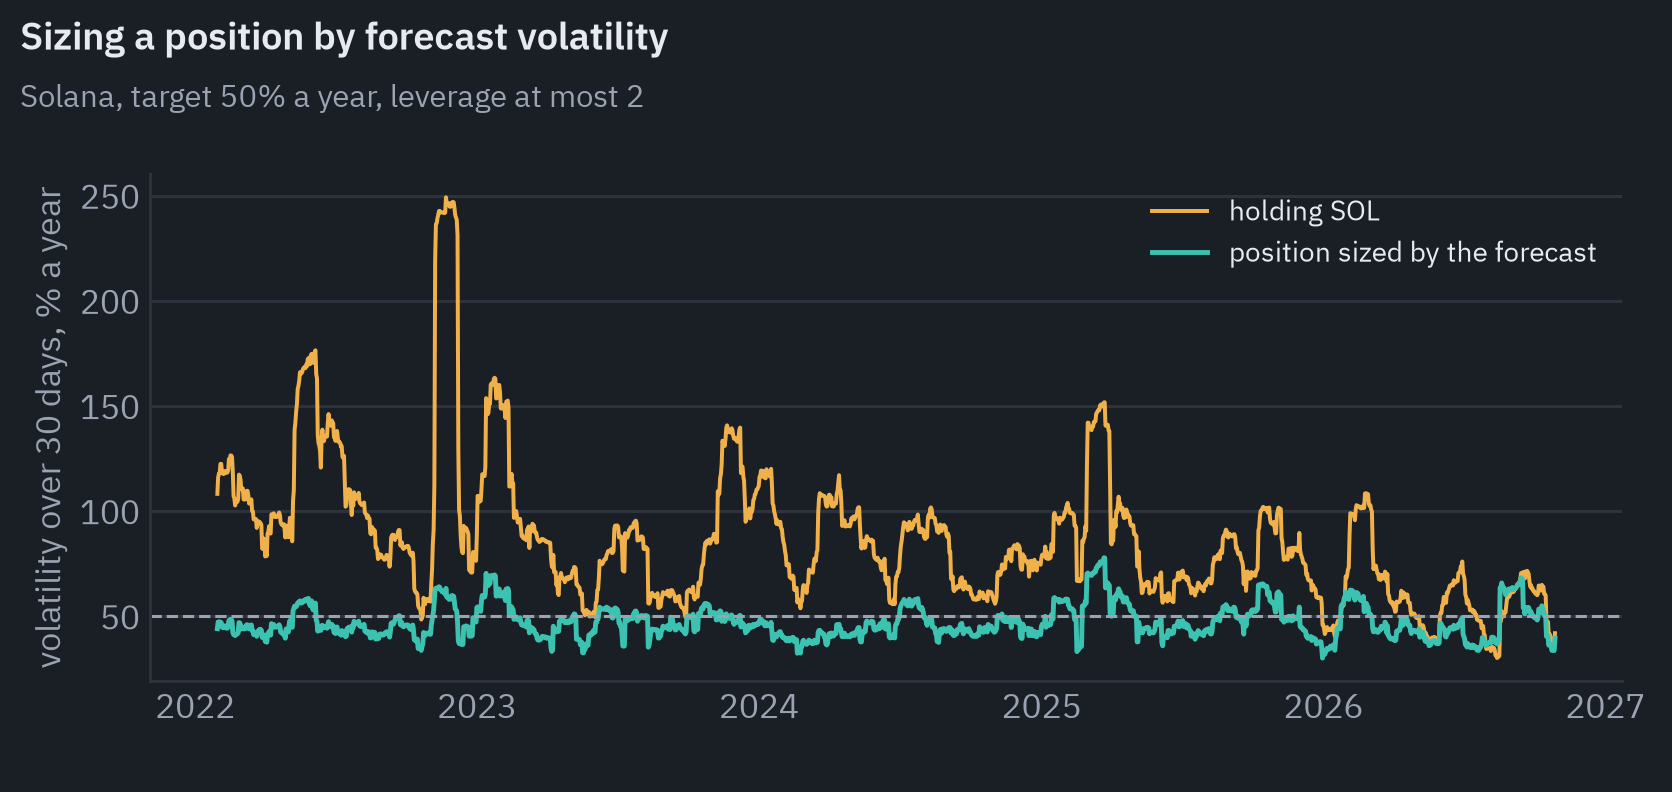
Holding Solana from 2022 to October 2026 meant a realized volatility of 93% a year and a worst fall of 94.5% from a peak. Scaling the position to a target of 50% held the realized volatility at 48% and cut the worst fall to 72%.
For Bitcoin it raised the Sharpe ratio, the return per unit of volatility, from 0.21 to 0.31. It does not make a bad asset good, but it makes the risk of a strategy predictable, and in a market with six-sigma hours that matters more than a percent of hit rate.
This is the part of machine learning that professional crypto firms use every day and rarely write about: forecasting volatility and liquidity, sizing positions, setting quotes, managing risk. The models are less glamorous than price prediction and much more useful.
The backtest that flatters
Every number so far comes from data the models never saw. Most strategies offered to traders, including many sold as AI, come from the opposite procedure: try many ideas on the same history and keep the one that looks best.
Machine learning engineers know this as overfitting to the validation set; in finance it has its own literature and its own name, backtest overfitting.
To see its size, I ran a grid of the rules every trading textbook contains: moving-average crossovers, breakouts of a price channel, and two kinds of mean reversion (RSI and Bollinger bands), each with a range of parameters, on the hourly candles of twelve large coins.
Sixty-six rules on twelve coins make 792 strategies. Each was scored by its Sharpe ratio, the average return divided by its standard deviation and scaled to a year, after a fee of 5 bp per side, once on 2021-2023 and once on 2024 to October 2026:
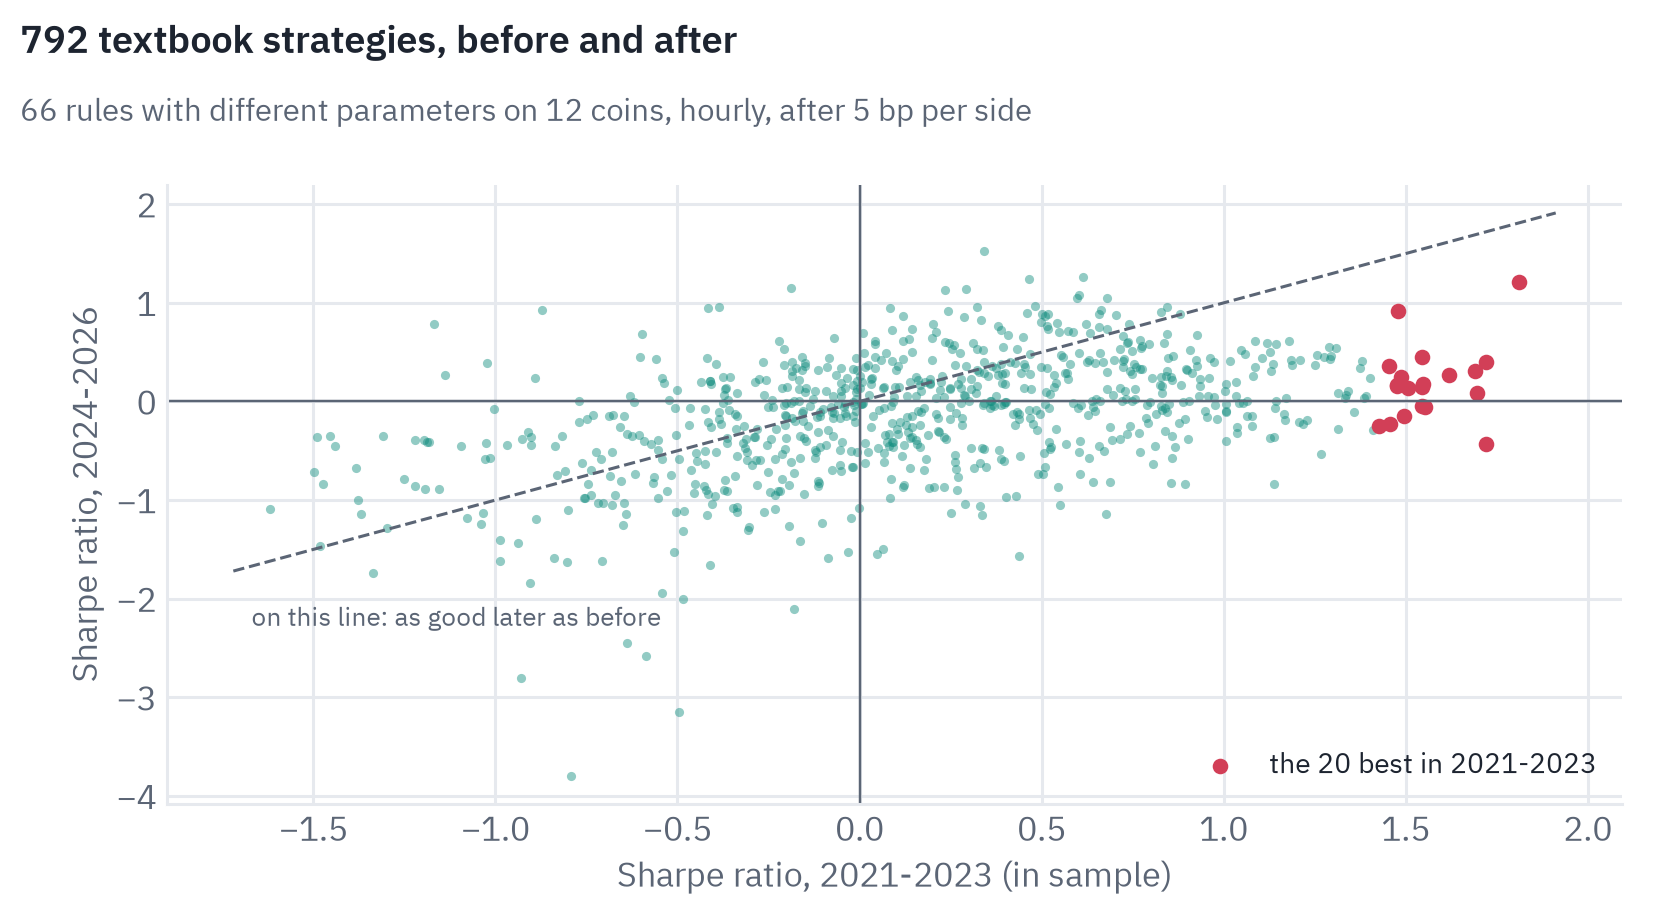
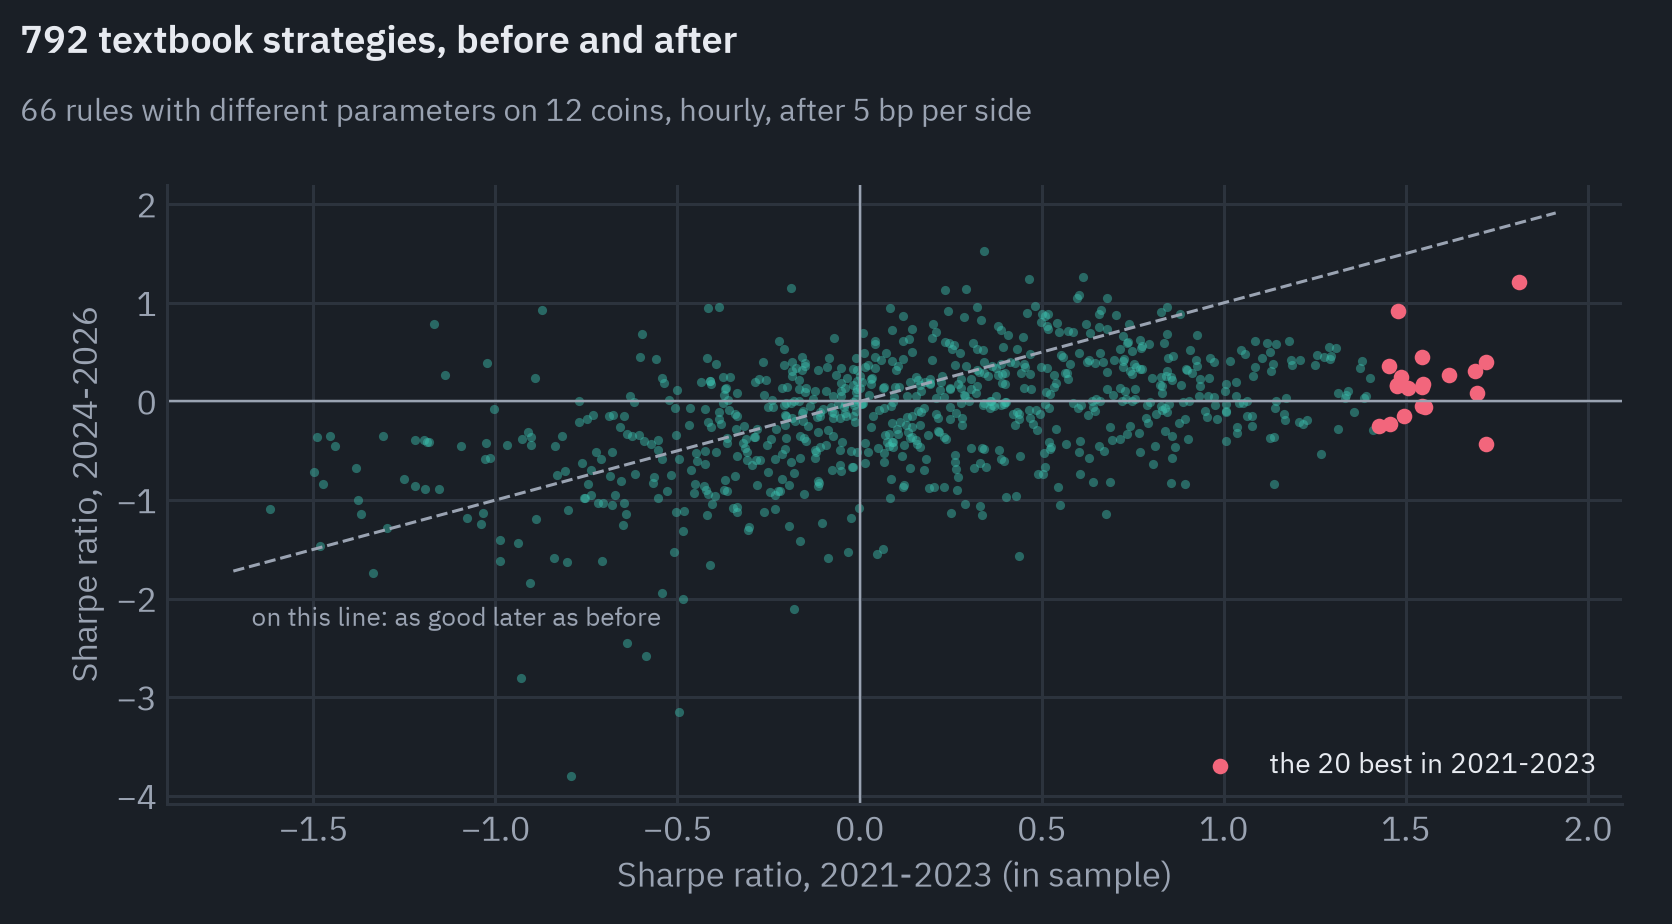
The ranking in the first period was not useless: its rank correlation with the second is 0.45, mostly because it identifies the rules that trade too often and lose to fees in any period. Mean reversion with RSI and Bollinger bands lost money in both.
The winners are another matter. The 20 best strategies of 2021-2023 had an average Sharpe ratio of 1.56; from 2024 on, their average was 0.19, and 6 of the 20 lost money. They kept about an eighth of what the backtest promised.
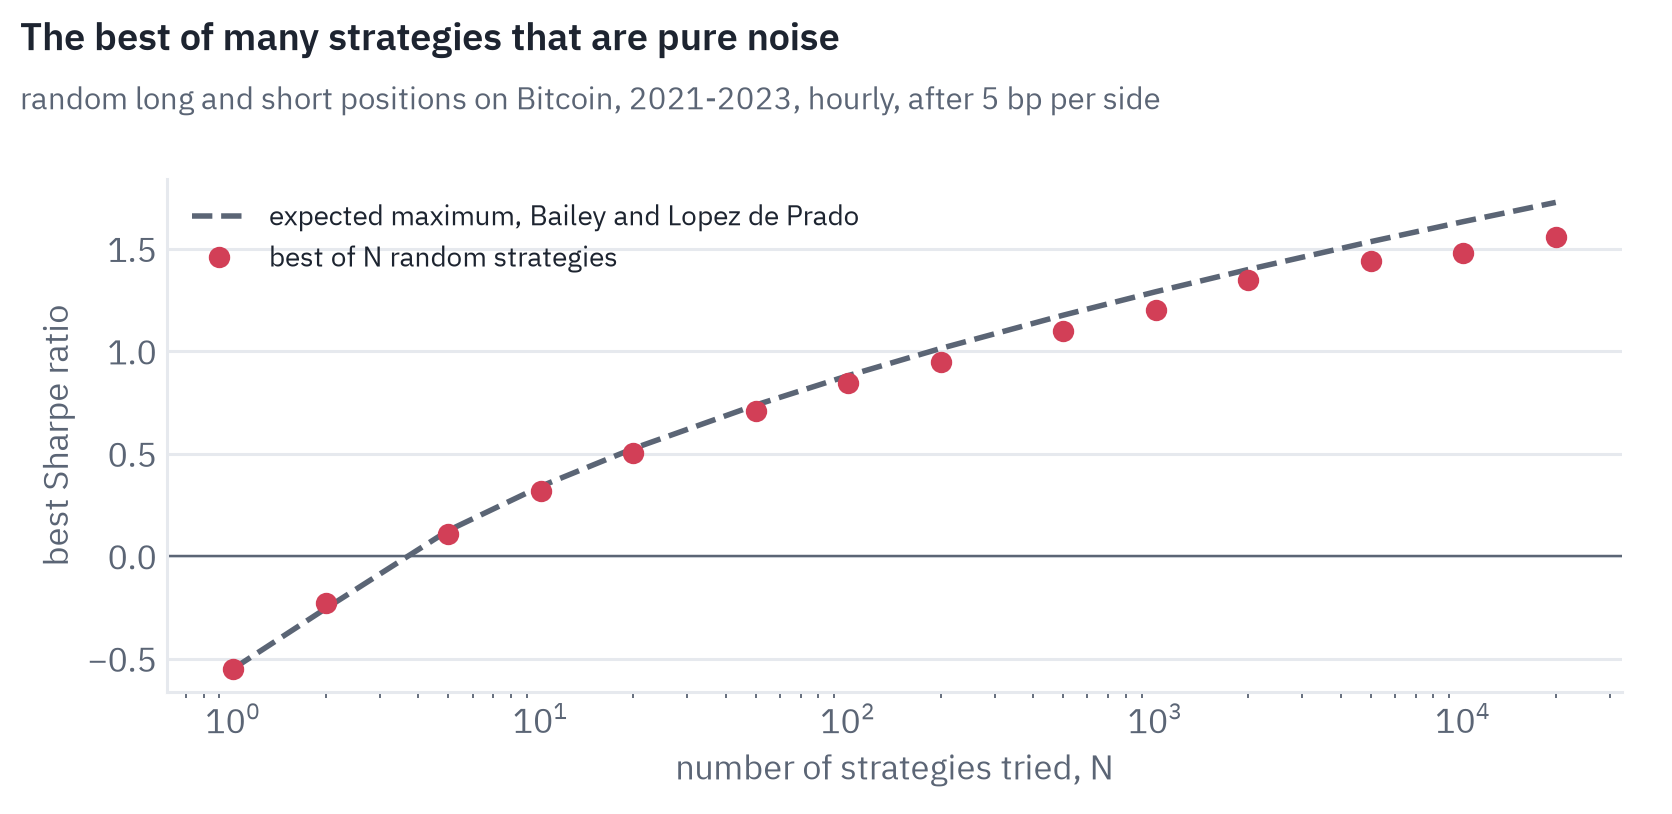
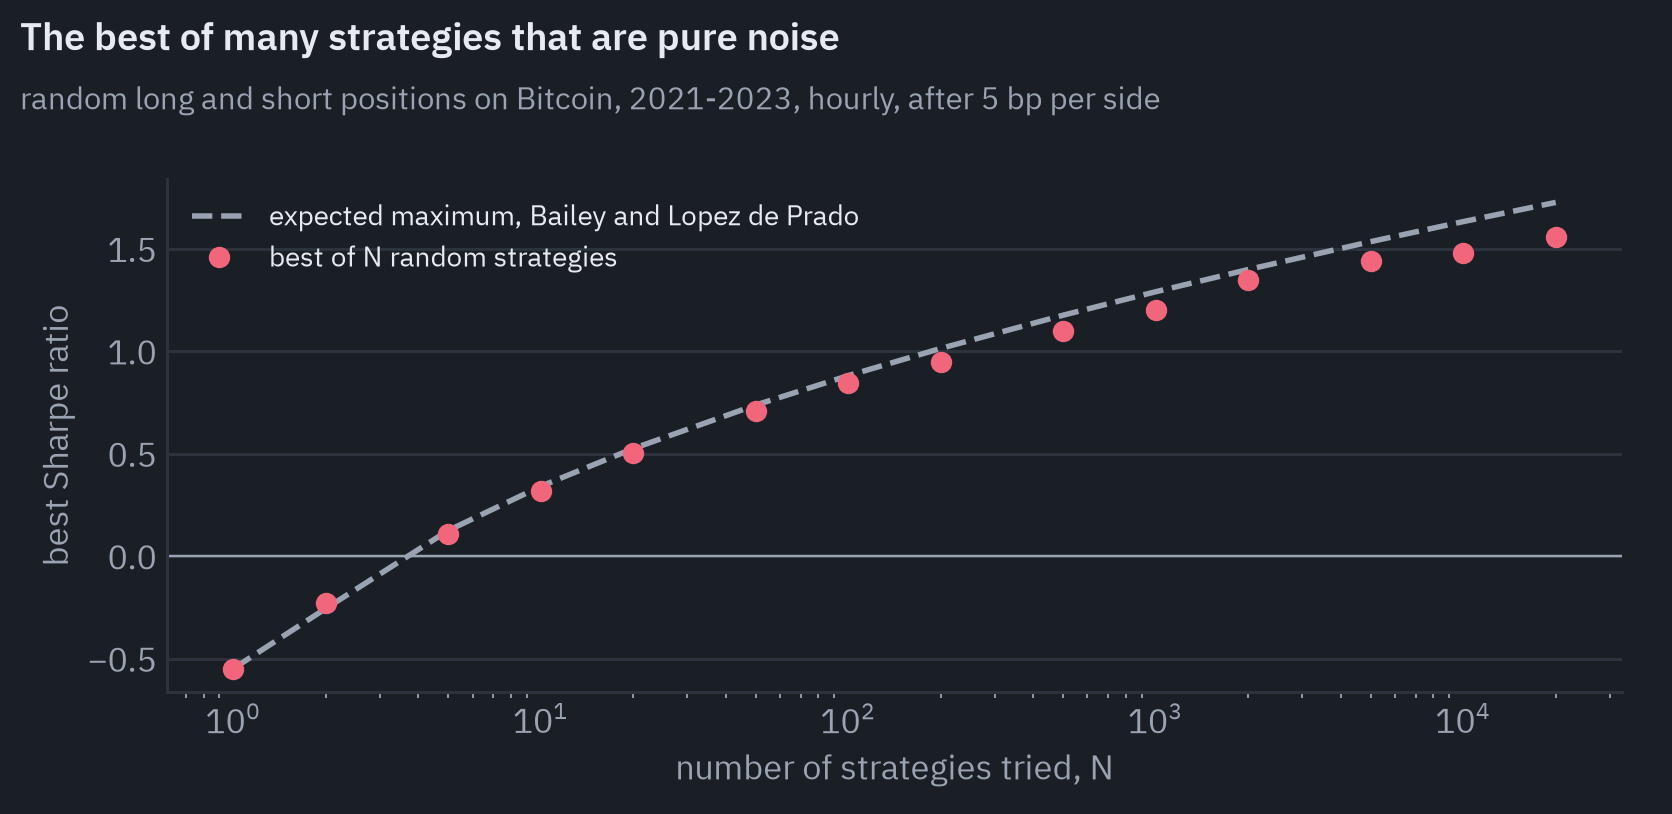
The second experiment removes any doubt about what is skill. Each of 20,000 strategies holds a random position, long or short, and flips it at random about once a day; none of them knows anything. Among \(N\) of them, the best one still looks good, and the more of them one tries, the better the best looks:
Bailey and López de Prado (2014) gave the expected best Sharpe ratio among \(N\) independent trials that have no skill:
\[\mathbb{E}\big[\max_N \widehat{SR}\big] \approx \mathbb{E}\big[\widehat{SR}\big] + \sqrt{V}\left((1-\gamma)\,\Phi^{-1}\!\Big(1 - \frac{1}{N}\Big) + \gamma\,\Phi^{-1}\!\Big(1 - \frac{1}{N e}\Big)\right).\]Here \(\mathbb{E}[\widehat{SR}]\) and \(V\) are the mean and the variance of the estimated Sharpe ratios across the trials, \(\Phi^{-1}\) is the inverse of the standard normal distribution function, \(\gamma \approx 0.5772\) is the Euler-Mascheroni constant and \(e\) is Euler’s number. The formula is the expected maximum of \(N\) normal draws, and it grows like \(\sqrt{2 \ln N}\): slowly, but without limit.
Here the average random strategy has a Sharpe ratio of −0.55, because it pays fees for nothing. The best of 10 has 0.32, the best of 1,000 has 1.20, and the best of 20,000 has 1.56, as good as the 20 best real rules looked in their own past. The formula, with the trials’ average added, follows the experiment closely.
Their deflated Sharpe ratio turns this into a test: it asks how likely the best strategy’s true Sharpe ratio is to be above zero, given how many strategies were tried and how long and fat-tailed the record is[7].
Applied to the best rule of my grid, the in-sample Sharpe ratio of 1.81 is below the 2.04 that the best of 792 trials would be expected to reach by luck, given how much their results differ, and the probability that its true Sharpe ratio is above zero comes out at 35%.
That rule, a crossover of 12- and 24-hour averages on Dogecoin, did well afterwards anyway, with a Sharpe ratio of 1.21. A deflated Sharpe ratio is a probability, not a verdict; what it says is that the backtest alone was not evidence.
The same arithmetic applies to every published result. Harvey, Liu and Zhu counted at least 316 factors that academic papers had tested to explain stock returns and concluded that, after so much searching, a new one should have a t-statistic above 3 rather than the usual 2 to be taken seriously[8].
A seller of a trading bot who shows the best of their backtests is showing the maximum of \(N\) draws, and rarely says what \(N\) was.
Language models as traders
Short records have a second problem besides selection: they are too short to tell skill from luck even for one strategy. Under the simplest assumptions, the standard error of an annualized Sharpe ratio estimated from \(D\) days of crypto trading is about
\[\mathrm{SE}\big(\widehat{SR}\big) \approx \sqrt{\frac{365}{D}},\]so 17 days of Alpha Arena give an uncertainty of about 4.6. A model would have needed an annualized Sharpe ratio above 9 to stand out from zero.
Trading more often does not help: the precision is set by calendar time, not by the number of decisions[9]. To show that a strategy has a Sharpe ratio of 1, the usual level of a good one, takes about four years of daily returns.
The academic benchmarks of LLM traders run into the same wall. AI-Trader tested six models on ten coins for two weeks of November 2025; five of the six did worse than an index of the same coins[10].
In StockBench, thirteen models traded twenty Dow stocks for four months and returned between −2.8% and +2.5%, against +0.4% for simply holding the stocks; in a second test over the falling market of early 2025, every agent did worse than holding[11].
LiveTradeBench found that a model’s rank on general benchmarks says nothing about its returns: the rank correlation was 0.05[12].
The largest record I know of is the least flattering. A company that runs two fleets of LLM agents published six months of their trades; on Hyperliquid, 500 to 600 user-created agents lost money, won 41% of their round trips against 50% for comparable human retail traders, and used a median leverage of 5 regardless of how volatile the market was.
Liquidations were 3.2% of the closed positions and 74% of the gross loss[13]. It is the operator’s own paper, which makes the result harder, not easier, to dismiss.
Longer tests are possible only on history, and history brings in a problem specific to language models. A model trained on text up to some date has read what happened before it. An LLM asked in 2026 whether to buy Bitcoin on 1 March 2020 may simply remember what came next.
To see how much, I asked seven open models released between May 2024 and February 2026 about Bitcoin, from January 2018 to October 2026.
Each model answered three kinds of questions: what Bitcoin closed at on the 1st and the 15th of every month, whether it went up or down over a given month, and whether it went up or down over a given week.
For the up-or-down questions I did not let the models write an answer; I read the probabilities they gave to “up” and “down” as the first word, so that a model that would rather explain that it cannot know still had to lean one way. The models ran on Kaggle’s GPUs, in 16-bit precision and without any tools or web search.
The price answers show where each model’s knowledge ends:
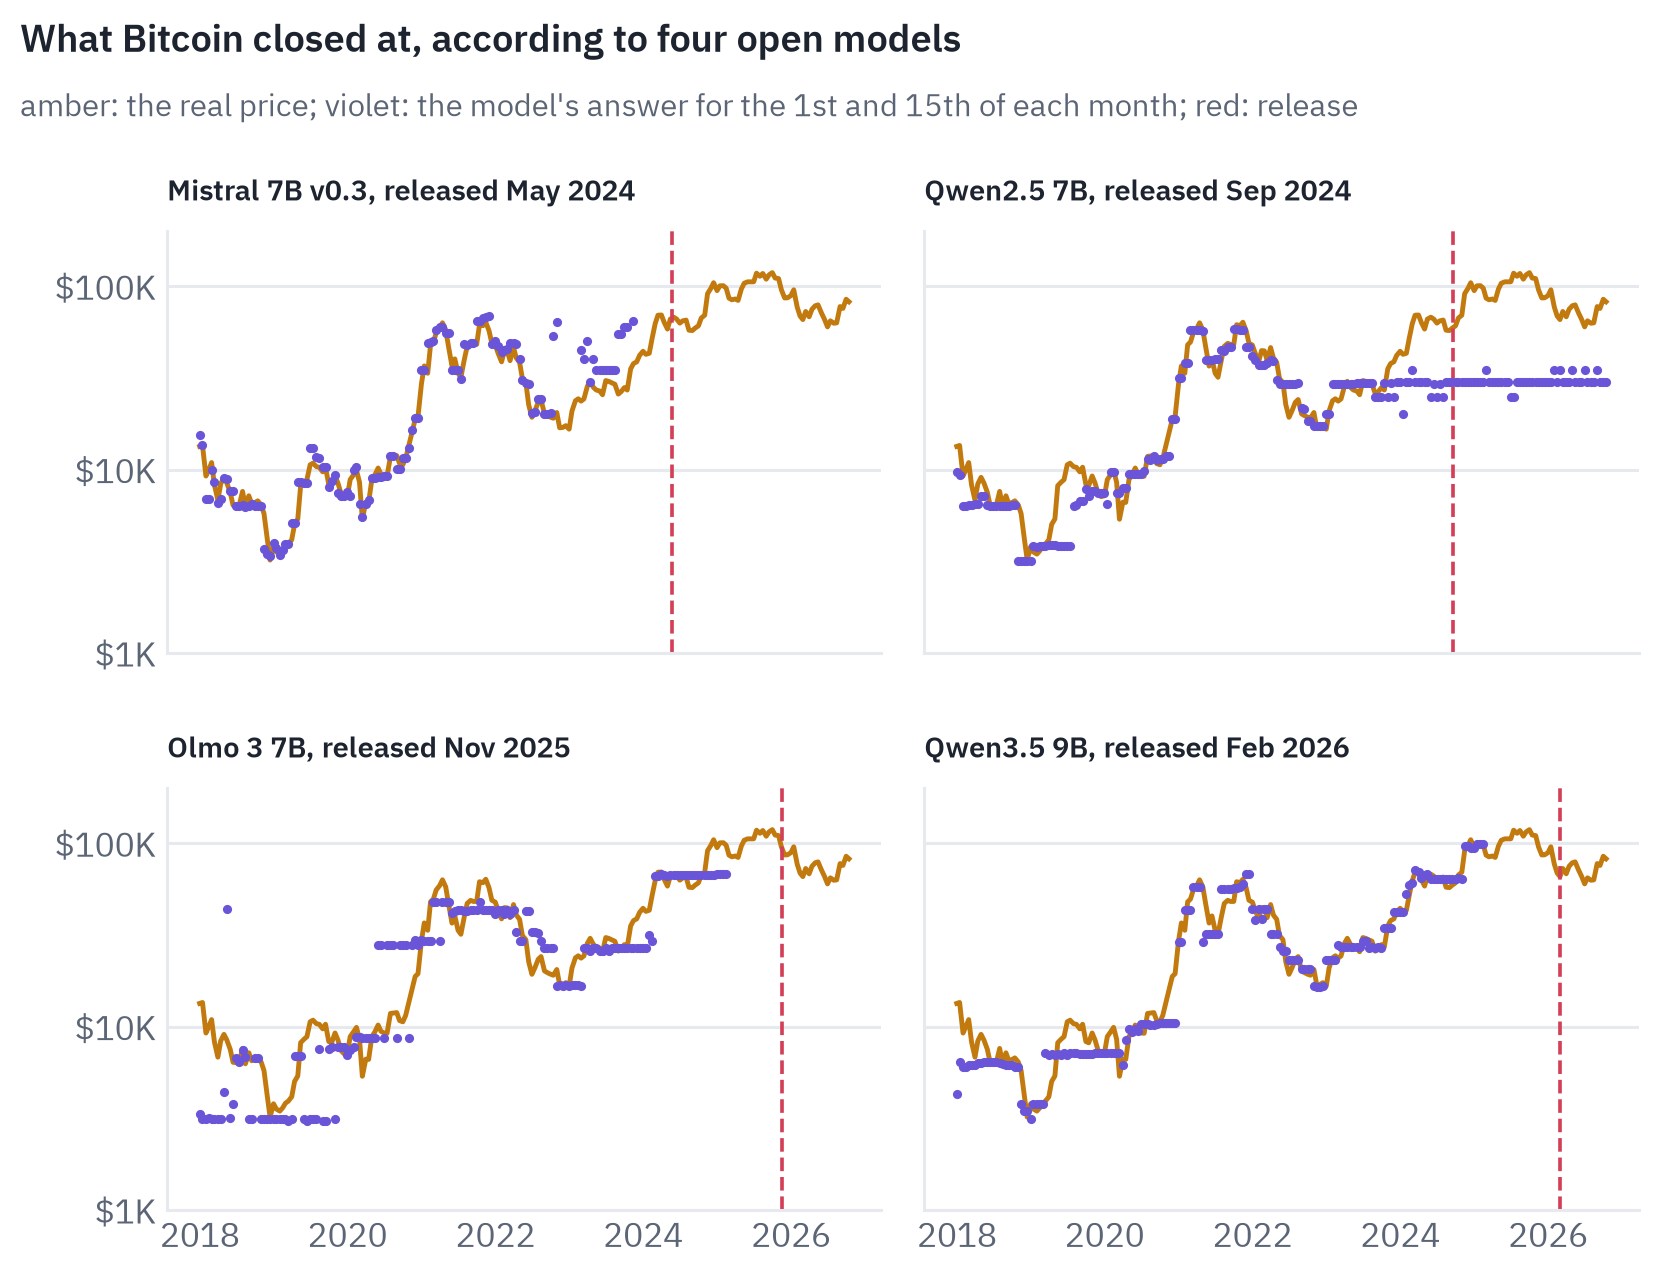
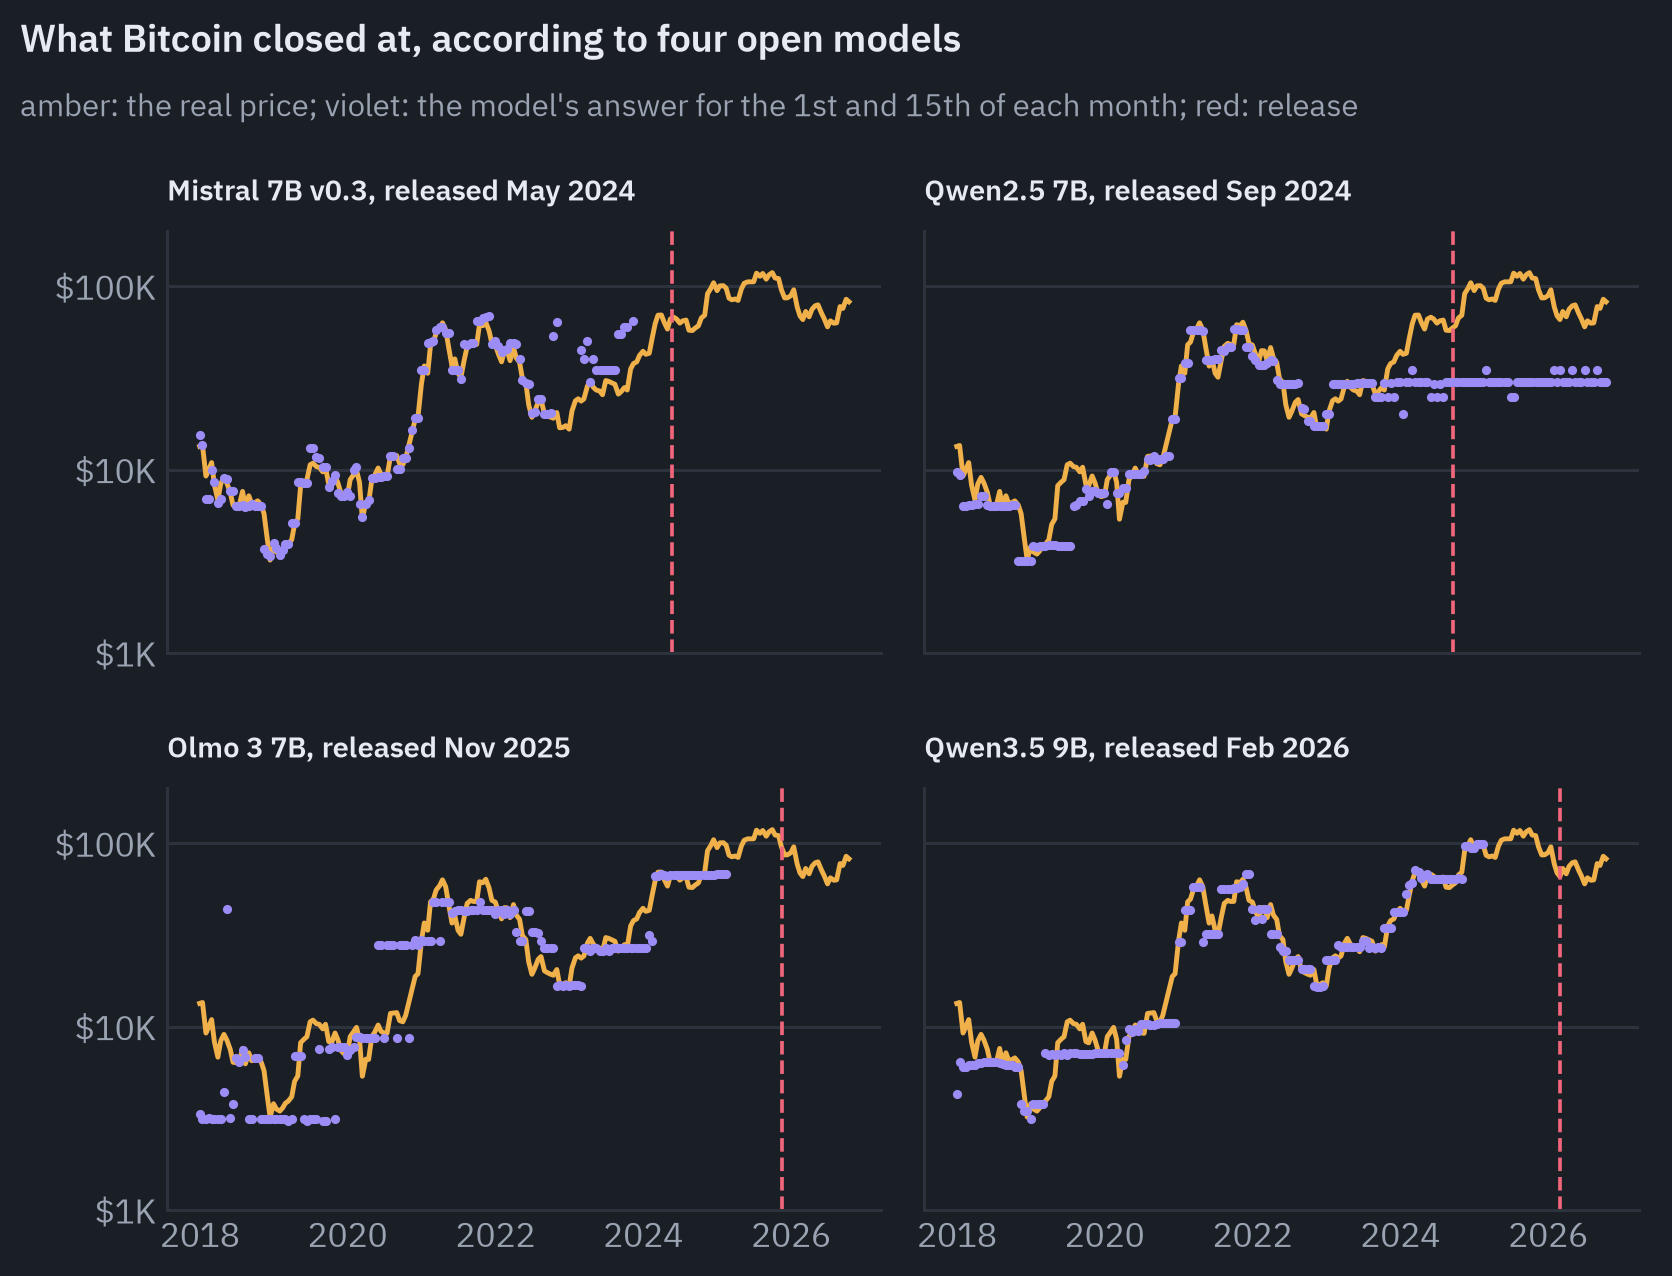
Mistral 7B, released in May 2024, named Bitcoin’s closing price for dates in 2018 to 2022 with a median error of 3 to 5%; for every date after its release it declined to give a number.
Qwen3.5 9B, released in February 2026, was off by 4 to 5% on dates in 2023 and 2024, still close in January and February 2025, and for every date from March 2025 on it answered “0”: its knowledge ends a year before its release.
Olmo 3 7B had a median error of 9 to 10% for 2023 and 2024 and explained, in one of its refusals, that it had no data “beyond my knowledge cutoff in June 2023”, which its own answers contradict.
None of these models was trained to know prices. They picked them up from the internet the way they picked up everything else.
Direction is what a trading backtest needs, and the models remember it too:
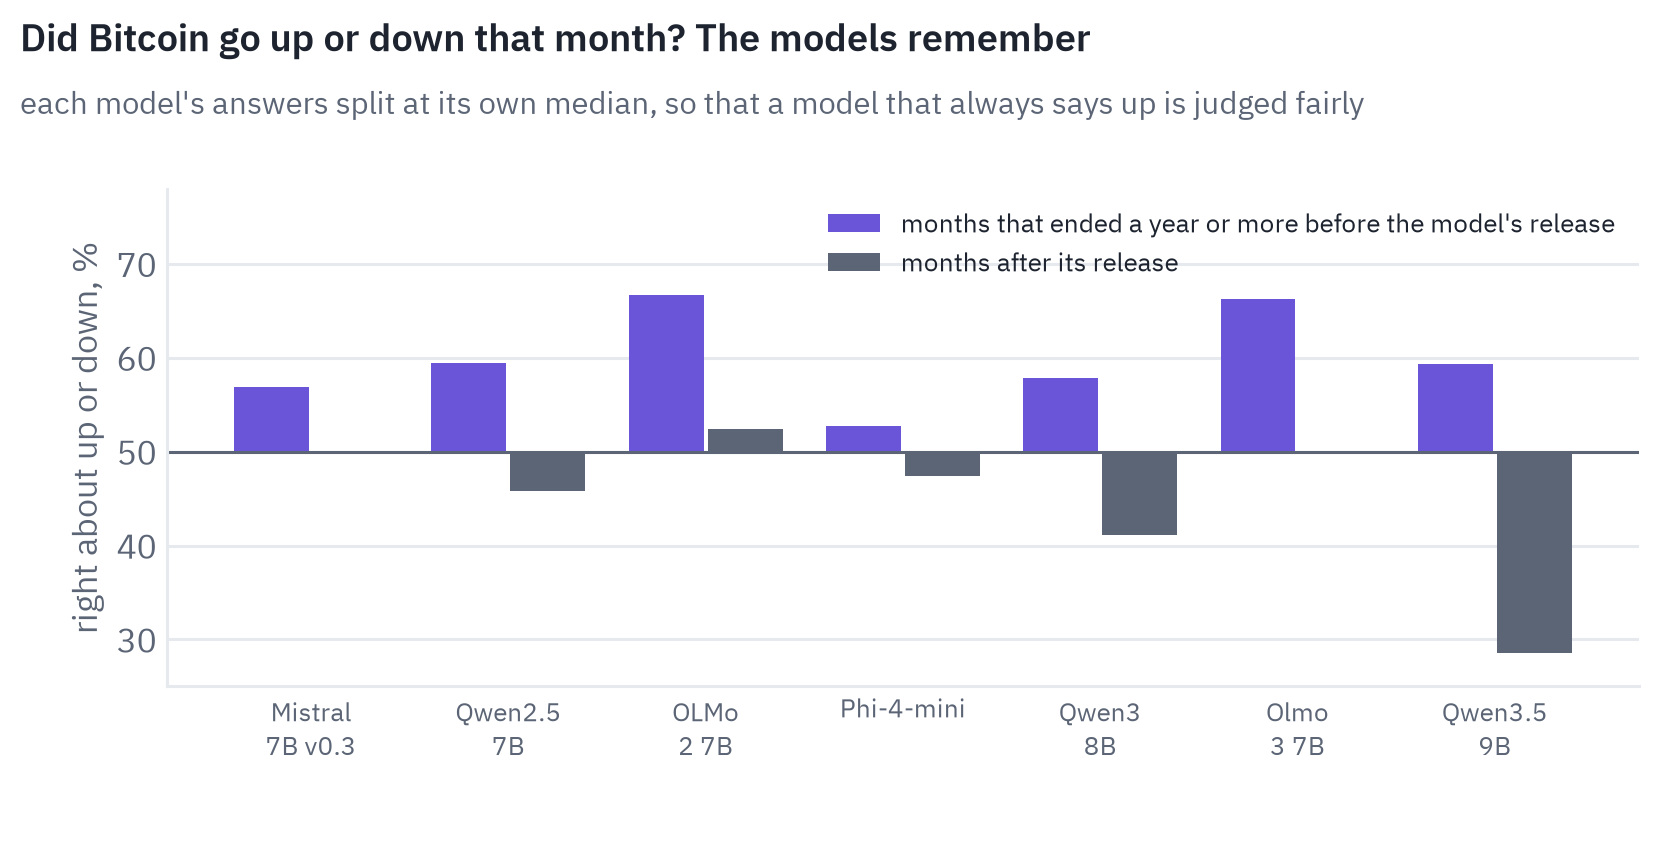
Over the months that ended at least a year before a model’s release, the seven models together called the direction right 60.0% of the time, in 525 answers; over the months after their release, 46.8% of 126.
Each model’s answers are split at its own median probability, so that a model that says “up” to everything is judged by how it orders the months.
The newest models have only a few months after their release, so their grey bars are noisy; the pooled numbers are not. For weeks the effect is smaller, 53.3% against 49.0%, probably because far less is written about single weeks than about months.
Now suppose someone builds a trading strategy on these answers and backtests it on 2018-2026, as one would with any signal:
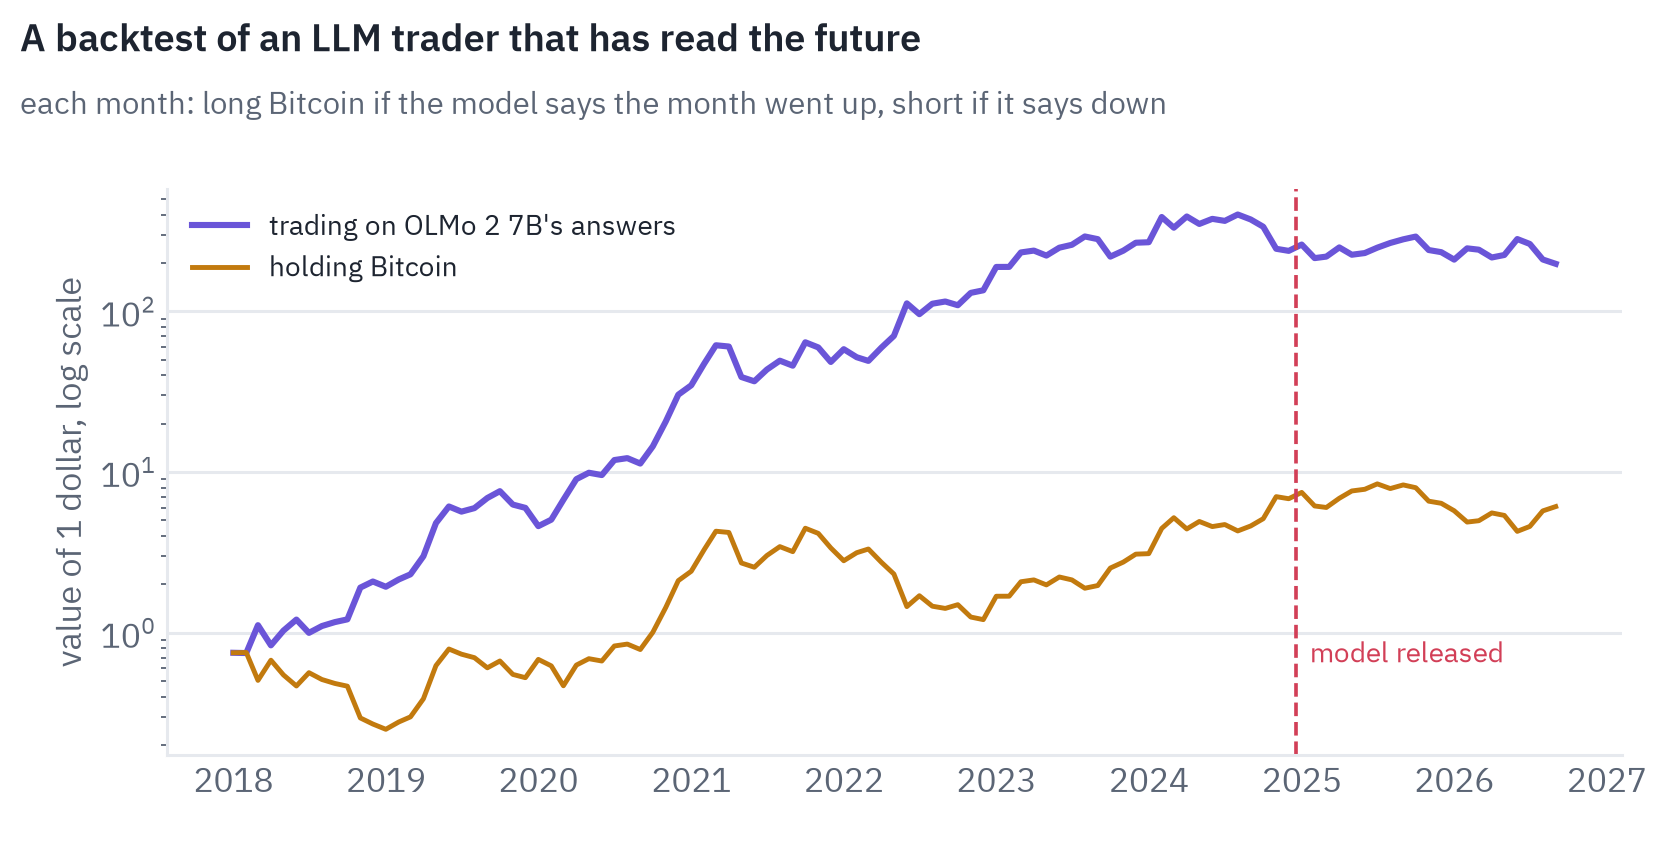
Trading OLMo 2’s monthly answers turns a dollar into 245 between January 2018 and November 2024, while holding Bitcoin turns it into 7. After the model’s release in December 2024 the same strategy loses 19% over 22 months.
Nothing in the backtest is wrong except the one thing that matters: the model had read the answers. Across the seven models, the strategy multiplied money by 8 to 245 before each model’s release and by 0.54 to 1.31 after it.
This is not a curiosity. Lopez-Lira, Tang and Zhu asked GPT-4o for daily levels of the S&P 500: before its training cutoff the error was 0.61%, after it 16.87%.
Telling the model to ignore what it knows did not help, and anonymizing companies did not either: from an earnings call with the names removed, it identified Apple, Meta and Microsoft every time[14].
When five published LLM trading agents were rerun on a period after their model’s cutoff, with a market return similar to their original period, their returns fell by 50 to 72%[15].
Over twenty years of data instead of a few months, holding the stocks beat the two best-known LLM trading agents in every setup[16].
There are fixes. Point-in-time models are trained only on text available up to a given date, one model per year, so that a backtest for 2015 uses a model that has never read 2016[17].
Their authors found the bias modest for one task, ranking stocks by the tone of the day’s news, which is a reminder that the size of the problem depends on what the model is asked.
For anything that names a coin and a date, the only clean test is the one that runs after the model was trained, live, for long enough.
Where language models help
None of this makes language models useless to a trader. They are weak at the job that is easiest to sell, taking prices in and sending trades out, and good at several jobs around it.
The clearest case is research. Man Group, one of the largest quantitative hedge funds, describes a pipeline of LLM agents in which one proposes hypotheses, another writes the code to test them on the firm’s data and a third runs the statistical tests; in their words, “whether generated by human or AI, every strategy entering live trading must pass identical thresholds”[18].
The thresholds matter because a model that writes a hundred strategies an hour is the fastest way yet to make \(N\) in the overfitting formula large.
Code is the second case. Coinbase says that between 95% and 100% of its code is now written by or with LLMs[19].
Data pipelines, backtests, exchange connectors and monitoring are where a trading team spends most of its time, and a model that writes them faster saves more than one that guesses the next candle. Reading is the third: whitepapers, governance proposals, the code of a smart contract.
Anthropic’s red team found that models could write working exploits for half of 405 smart contracts that had been hacked in the past, in simulation, and found two new vulnerabilities in recently deployed contracts[20]; the same skill reviews a contract before one deposits into it, and attacks it for someone else.
News is the case everyone expects to work. The evidence is thin: a 2026 study scored Bitcoin news with ChatGPT and found that the sentiment improved the fit in sample but added nothing significant out of sample[21].
Professional market makers, for their part, still hire for older skills. A recent job advertisement of Wintermute, one of the largest, asks a machine learning researcher to “develop ML-based alpha generation models using high-frequency order book and market microstructure data” and does not mention language models[22].
Forecasting events, rather than prices, is where language models have come furthest. On ForecastBench, a benchmark of questions about the future, several systems were by July 2026 “statistically indistinguishable from superforecaster-level accuracy”, and on questions taken from prediction markets one ranked above the superforecasters’ median for the first time; the human forecasts it was compared with were collected in 2024[23].
The money that bots have demonstrably made in prediction markets comes from something plainer: buying a set of outcomes that must together pay $1 for less than $1. On Polymarket this kind of arbitrage extracted an estimated $40 million in a year[24].
Then there are foundation models for time series, Transformers pretrained on millions of series in the way language models are pretrained on text.
Kronos was trained on more than 12 billion candles from 45 exchanges and reads open, high, low, close and volume as tokens[25]; Chronos-2 is a general forecaster from Amazon[26].
I found no independent test of them on crypto returns, so I ran one: both models, without fine-tuning, forecast every hour of 2026 for Bitcoin, Ether and Solana from the 512 hours before, and Chronos-2 also forecast daily volatility.
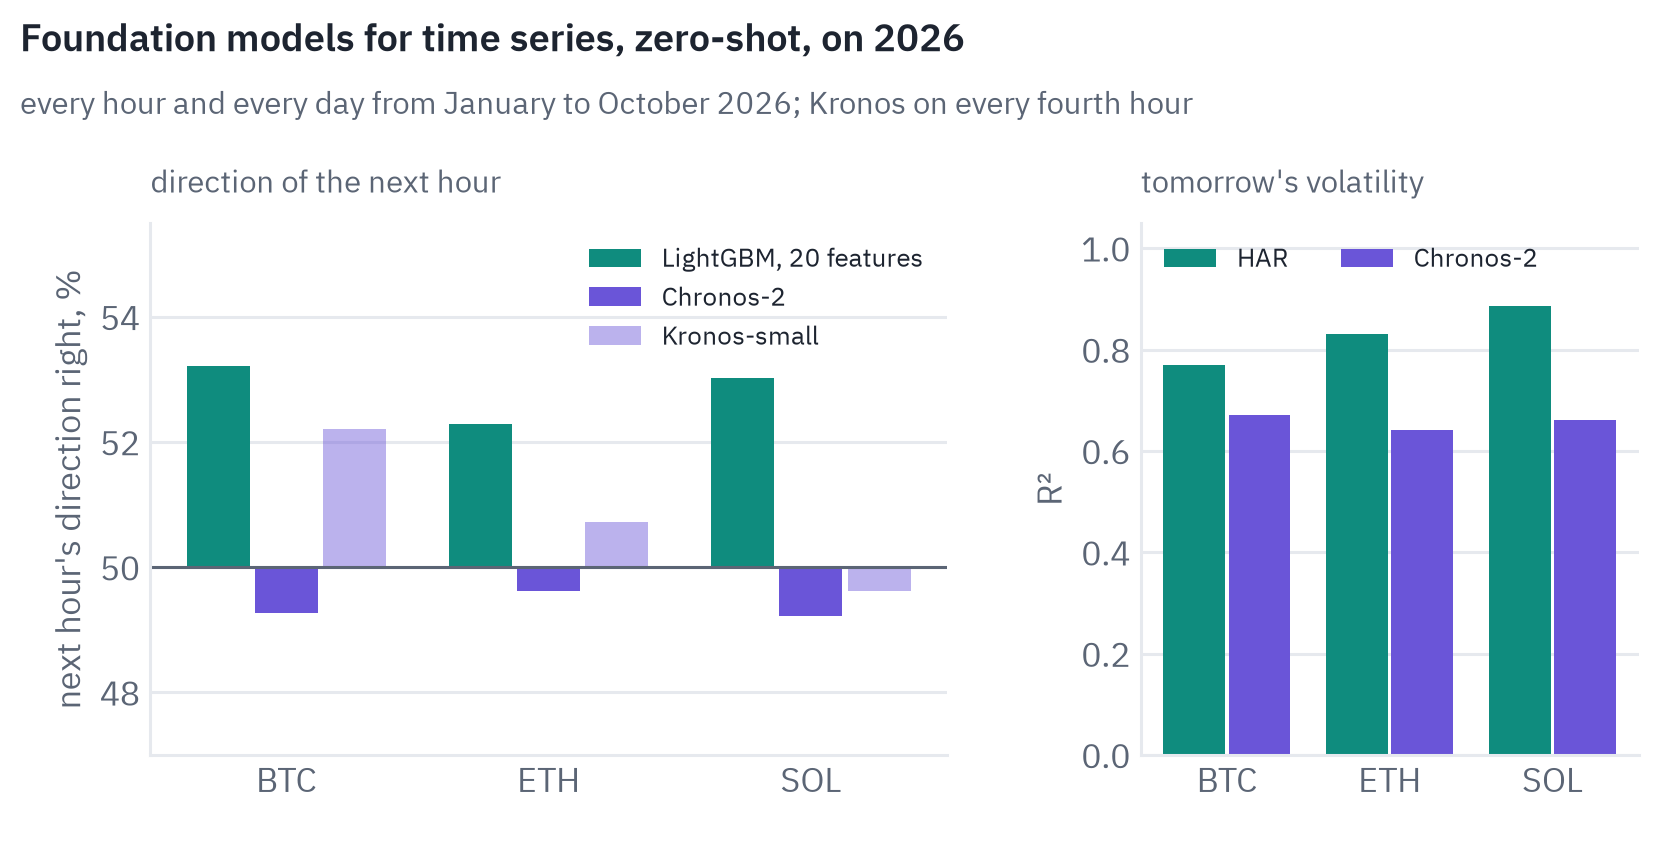
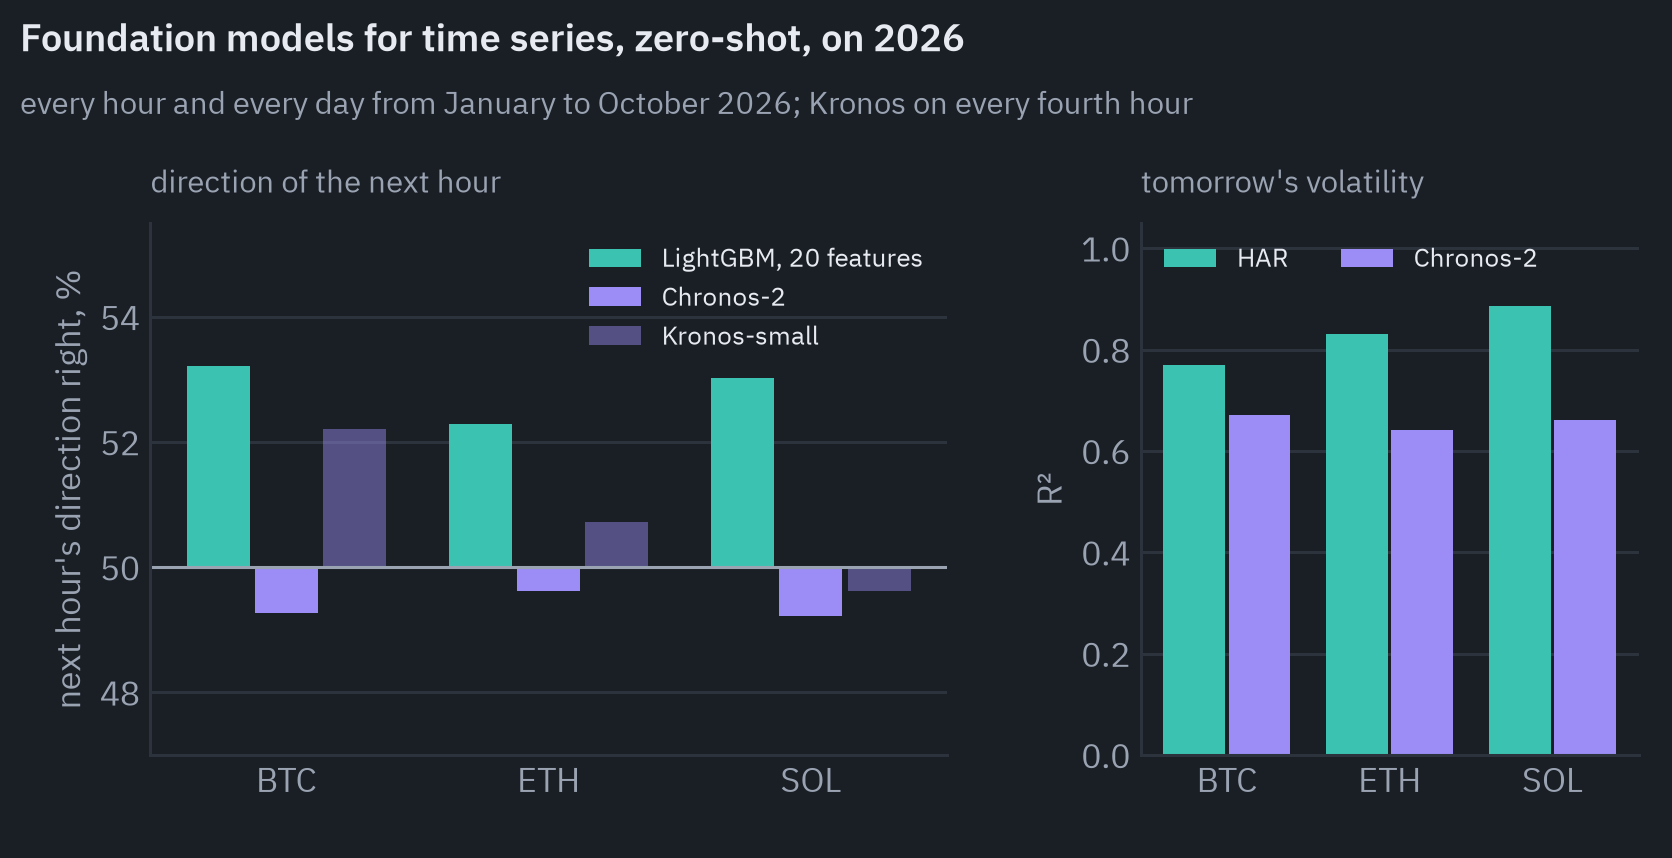
Neither model knows the direction of the next hour. Chronos-2 was right 49.2 to 49.6% of the time, slightly worse than a coin, and said “up” in 66 to 75% of the hours: from a series of hourly returns it learned mostly that the average is a little above zero.
Kronos-small was right 49.6 to 52.2% of the time on the hours it forecast; with 1,812 hours per coin, a deviation of one or two points from 50% is within noise.
The gradient-boosting model with its twenty hand-made features did better on the same months, which is what one would expect from a model trained on this very market.
Volatility tells the same story as before. Chronos-2, which has never been trained on crypto in particular, forecast tomorrow’s log volatility with an \(R^2\) of 0.64 to 0.67 against the average of the previous 512 days; the HAR regression with four coefficients scored 0.77 to 0.89 on the same days.
A large pretrained model learned that volatility clusters, and a model built around that fact still knows it better.
Independent tests on stock returns found the same: zero-shot Chronos and TimesFM had negative out-of-sample \(R^2\) on returns, where gradient boosting was close to zero[27], and on realized volatility only a tiny model beat the logarithmic HAR[28].
Agents with keys
In crypto, “AI agent” first meant something other than a trading system. In 2024 a chatbot called Truth Terminal, which posted on X, received a $50,000 research grant in bitcoin from Marc Andreessen and then promoted a memecoin that someone else had launched[29].
Tokens of other “AI agents” followed, and at their peak around the turn of 2025 they were worth about $16 billion together; most have since fallen by more than 90%[30]. In August 2026 the founder of ai16z, a token once worth $2.4 billion, wrote: “The token is dead. Completely”[31].
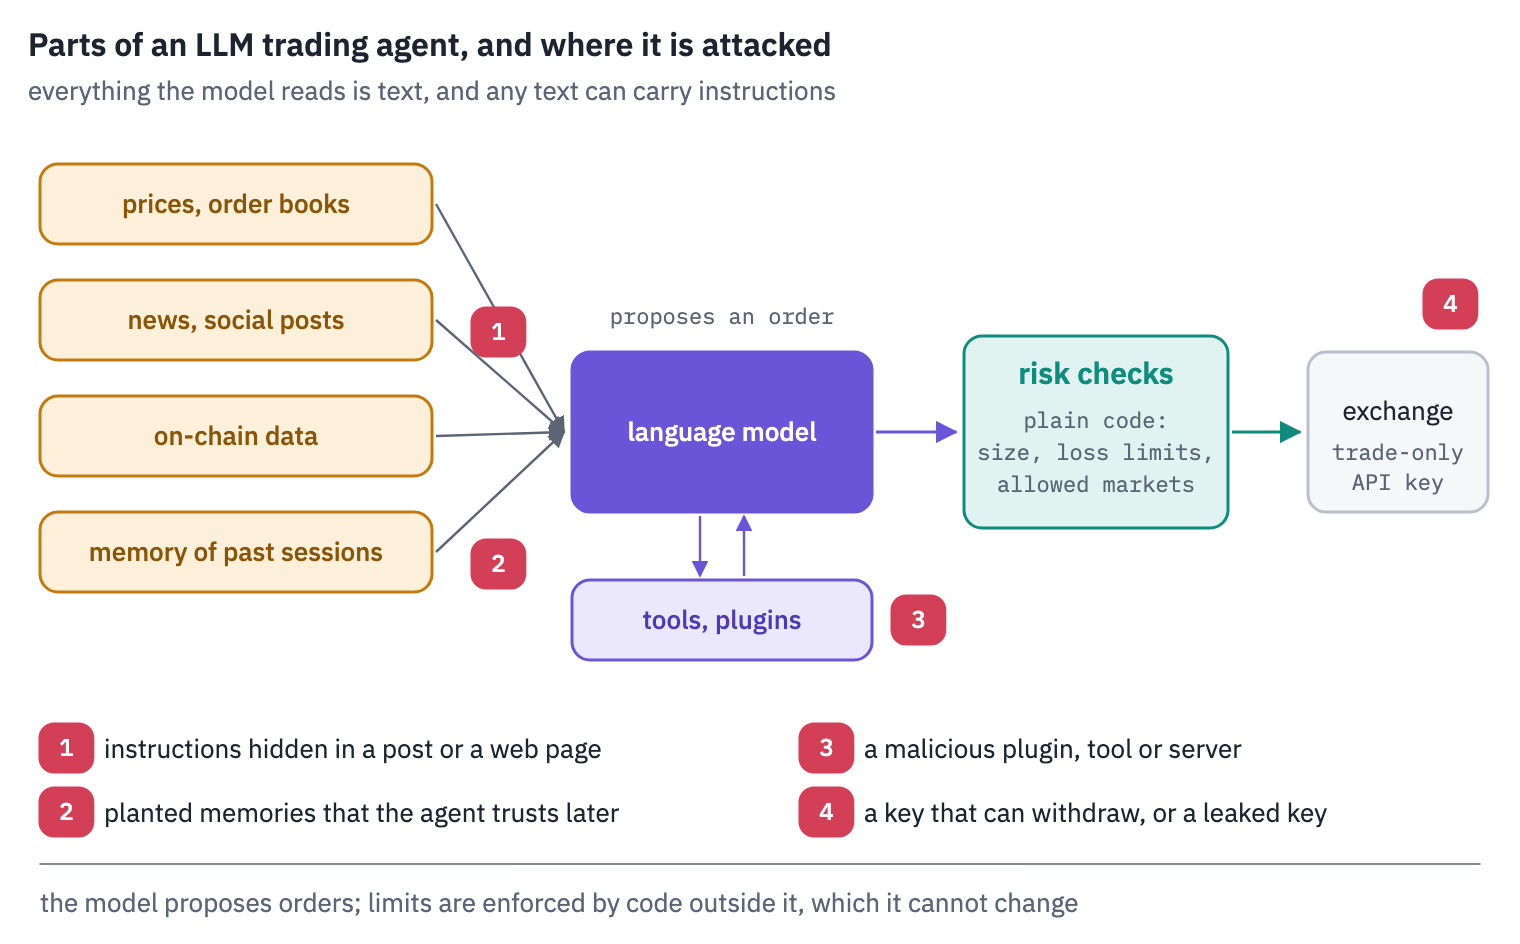
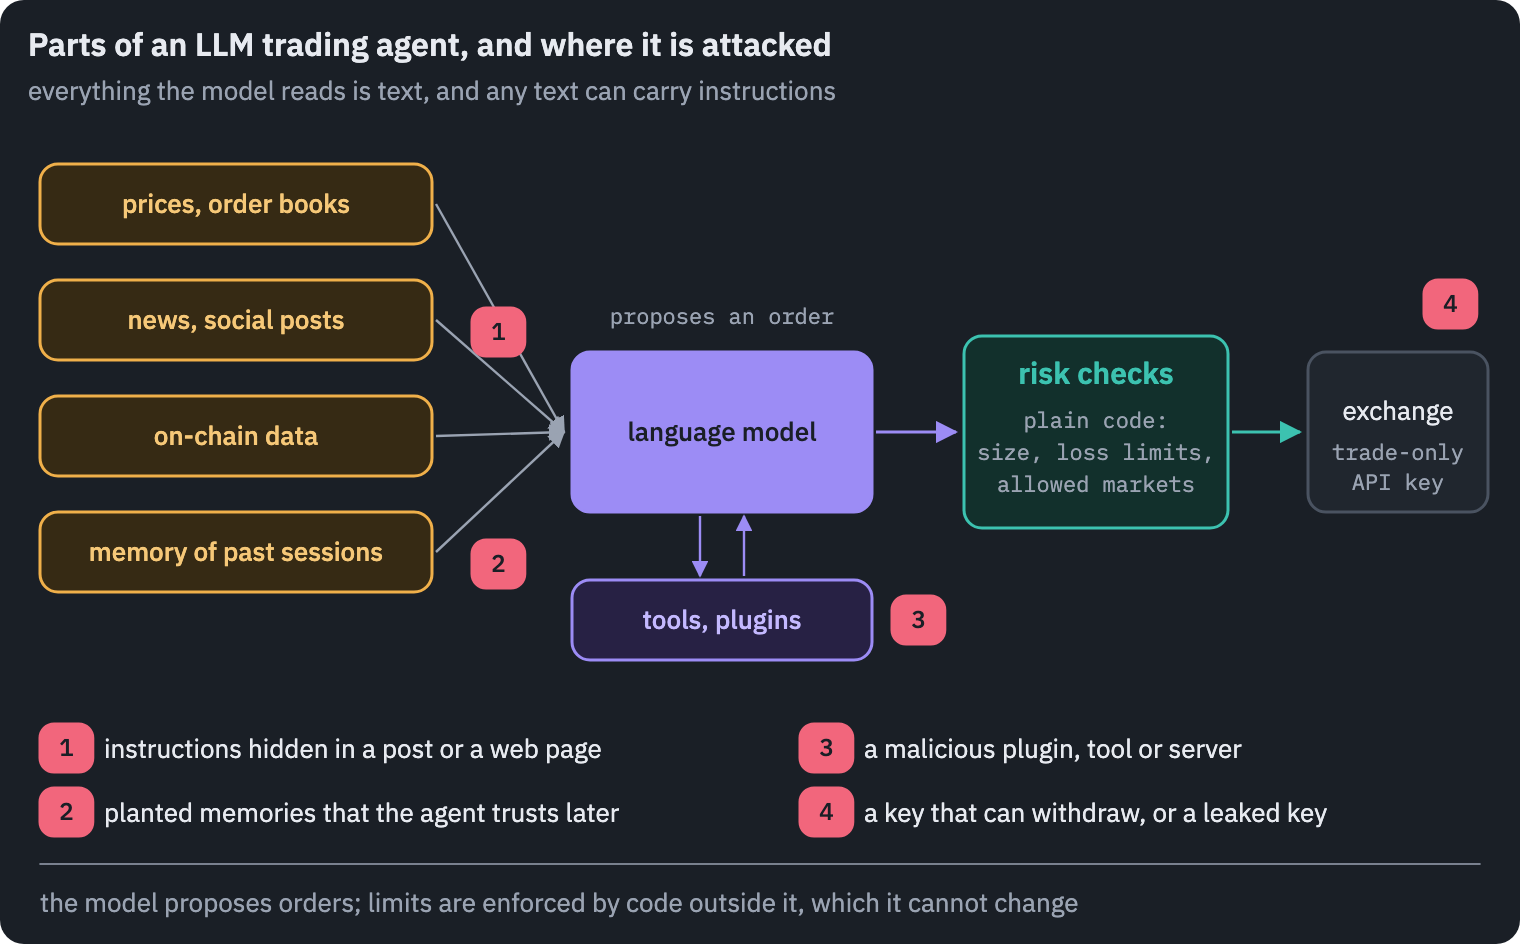
The agents themselves outlived their tokens, and the interesting question about them is not price but security. A program that reads the internet and can move money is a new kind of target, because everything it reads is text, and a language model treats text as a possible instruction.
The first public demonstration was a game. Freysa was an agent with a wallet and one rule, never to send the money; players paid a rising fee per message to try to talk it into doing so.
After 482 attempts one player convinced it that its transfer function was for receiving funds, offered a donation, and took the prize of $47,316[32].
The real incidents are less elegant. In March 2025 someone with access to the dashboard of AIXBT, an agent that posts market commentary, queued two replies that made it send about 55 ETH, some $100,000, from its wallet; the team said it was “not a result of agent manipulation”, which makes it an ordinary access-control failure with an AI attached[33].
In May 2026 an attacker sent Grok’s wallet a membership NFT that widened what the wallet was allowed to transfer, then posted a message in Morse code; Grok decoded it into an instruction to a trading bot, Bankrbot, which sent 3 billion DRB tokens, worth about $150,000 to $200,000[34]. No key was stolen and no contract had a bug.
Memory makes this worse. Researchers at Princeton showed that an attacker can plant a false instruction in an agent’s long-term memory through an ordinary conversation, and the agent later acts on it when other users make legitimate requests. In their summary, “even the strongest models followed poisoned memories more than half the time”[35].
The tools around the model are a supply chain of their own. Of 2,857 skills in one open marketplace for agents, a security firm found 341 malicious, 163 of them dressed as crypto tools and prediction-market bots[36].
An MCP server published on npm asked for a wallet’s private key to “auto-sign” payments and sent it to a remote server with every call[37].
Of 428 third-party routers that resell access to LLM APIs, researchers found nine that injected malicious code, and one that drained ETH from a key planted as bait[38].
Even the news can be an attack: altering headlines with invisible characters on a single day cut a sentiment-trading system’s annual return by up to 17.7 percentage points[39].
The exchanges’ agent toolkits of 2026 have converged on the same defence. Binance’s lets agents trade from a walled-off sub-account but not move assets to an external wallet[40].
OKX signs orders on the user’s machine, so that “the AI client sends only trading intent”, and offers a mode with simulated funds[41]; Kraken’s command-line tool has a local paper-trading engine[42]. A key that cannot withdraw prevents theft. It does nothing against an agent that loses money by trading.
The design that follows from all this is old-fashioned. The model reads untrusted text and proposes; ordinary code decides, with limits on position size, leverage and daily loss that the model cannot change.
Memory is per user and is treated as untrusted input too. Tools come from sources one has read. And the model never holds a key that can send funds anywhere.
Bots that sell returns
Every claim in the previous sections can be checked against data. The market for “AI trading bots” mostly cannot, and regulators have been warning about it for years.
In January 2024 the US Commodity Futures Trading Commission published an advisory titled “AI Won’t Turn Trading Bots into Money Machines”, with a sentence that could close this post: “AI technology can’t predict the future or sudden market changes”[43].
Its main example was Mirror Trading International, which collected at least 29,421 bitcoin, worth $1.7 billion, from about 23,000 Americans for a trading “bot”[44]. In the advisory’s words, “in reality, very little money was actually traded.” The schemes of 2026 have updated the vocabulary, not the method.
In September the SEC charged two groups that sold access to AI trading bots and signals through WhatsApp; of one of them it wrote that “there were no AI trading bots and deposited funds never were used to earn returns for investors”[4].
On 29 October 2026 it sued a pair of companies that took more than $130 million for trading signals with a claimed accuracy of 99.6% and promised that “the monthly fund return rate is at least 60%”[45].
Sixty percent a month turns $1,000 into $281,000 in a year and into $22 million in three. A strategy that did this would not need investors.
The arithmetic of the earlier sections gives a better sense of scale: a model that is right 54% of the time on the next hour of Bitcoin, close to the best that published studies report, loses money at ordinary fees.
The losses are large. In 2025 Americans reported $7.2 billion lost to crypto investment fraud, the largest category of all in the FBI’s annual report, and more than $632 million in investment complaints where AI was mentioned[46].
Chainalysis found that scam operations that bought AI tools, from face swapping to text generation, earned 4.5 times as much as those that did not[47]. And in a survey by the UK’s Financial Conduct Authority, 44% of investors aged 18 to 40 believed that financial information generated by AI is regulated[48].
Strategies that do not need a forecast
Some of the steadiest money in crypto is made without predicting anything. A perpetual future is a contract that tracks a coin and never expires; to keep its price close to the coin’s, the side that is more crowded pays the other side every eight hours.
This payment is the funding rate. When more traders want to be long with leverage, which in crypto is most of the time, longs pay shorts.
Buying a coin and shorting the same amount of its perpetual cancels out the price risk and collects the funding. This is the cash-and-carry trade, and on Binance the rate defaults to 0.01% per eight hours, about 11% a year, when the two prices agree. What it actually paid looks like this:
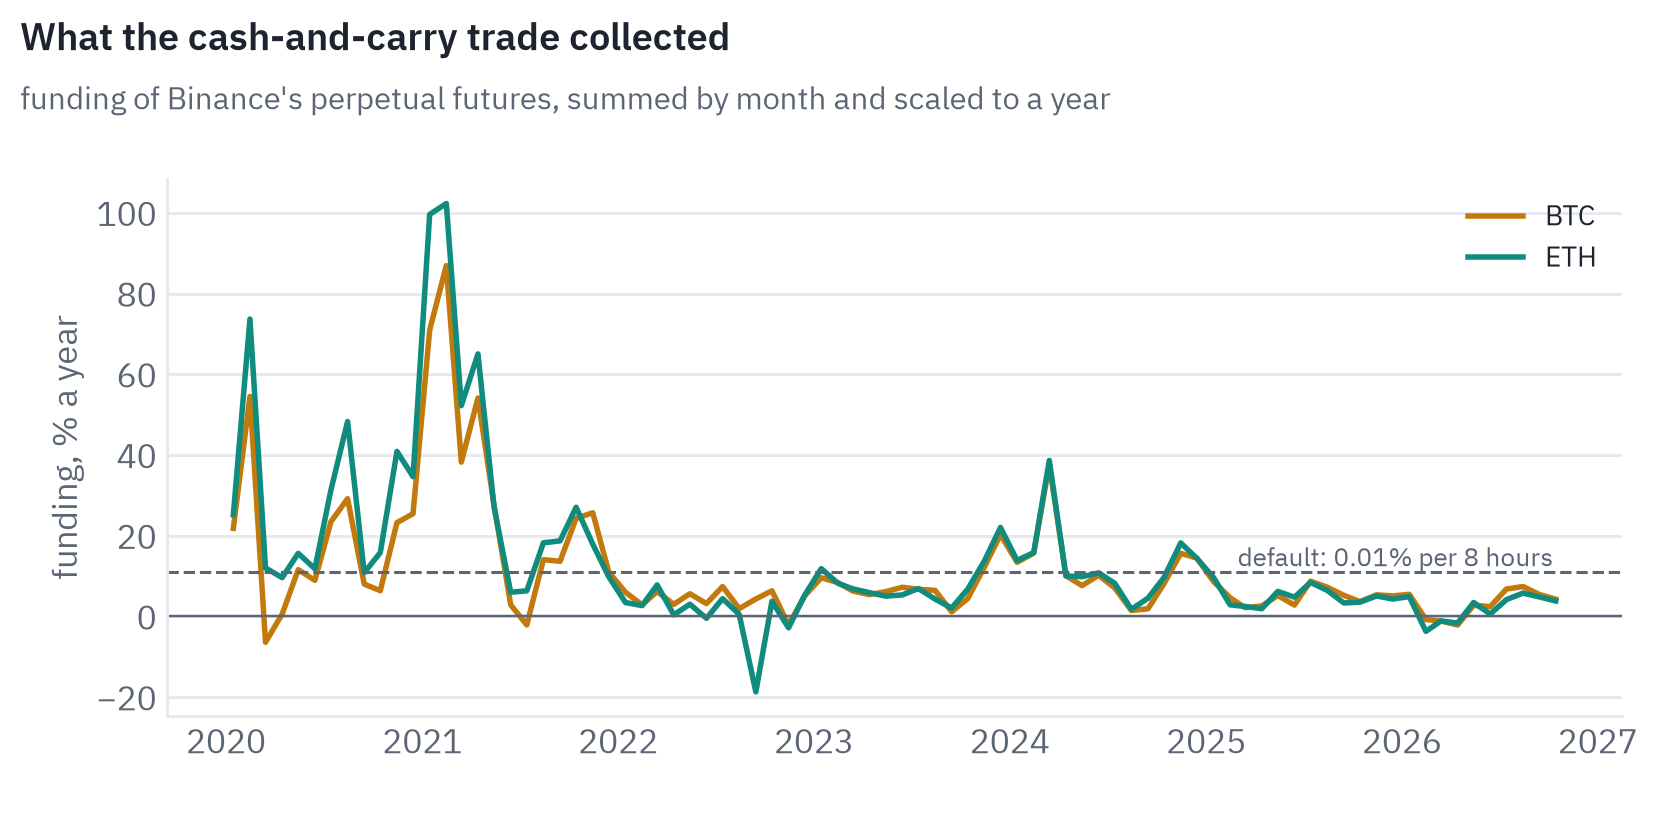
In 2021 the trade earned 30.6% a year on Bitcoin and 37.5% on Ether, from nothing but other traders’ appetite for leverage. Since then the Bitcoin trade has paid between 4 and 12% a year, and 3.1% in 2026 to the end of October, with a quarter of the payments going the other way.
A study at the BIS found crypto carry averaging more than 10% a year and sometimes reaching 60%[49]; the shrinking yield of recent years is what one would expect once a trade is easy to see and easy to automate.
Market-neutral is not risk-free. On the evening of 10 October 2025, after an announcement of new US tariffs on China, Bitcoin fell 12.6% on Binance in eighty minutes, Ether 14.1% and Solana 17.8%. More than $19 billion of leveraged positions were liquidated across exchanges.
Where insurance funds could not absorb the losses, exchanges closed profitable positions of other traders to cover them, a mechanism called auto-deleveraging, and among the positions closed were the short hedges of market makers[50].
On Hyperliquid alone it closed $2.1 billion of positions in twelve minutes[51]. A hedged trader whose hedge is closed by the exchange is no longer hedged.
The other risk is the exchange itself. A carry position lives on an exchange, and while I was writing this post the largest one stopped withdrawals after the hack mentioned above. A position that is neutral to the price of Bitcoin is not neutral to the solvency of the venue that holds it.
A realistic picture
Put together, the experiments draw a consistent picture, and it is less exciting than the advertising and more useful.
What machine learning does well in crypto is to forecast the things that have memory: volatility, volume, liquidity, the cost of trading.
These forecasts size positions, set quotes, route orders and keep a leveraged book alive through an hour like the evening of 10 October 2025. This is where the firms that make money from crypto markets put their models, and it rarely makes headlines.
Direction is a different matter. Short-horizon patterns exist, like the hourly reversal my model found, and other studies find them too: hit rates of 51 to 56% for Bitcoin from one minute to an hour ahead, with every model losing money once a round trip costs 30 bp[52]; on hourly Bitcoin bars from 2018 to 2026, models that earned 74 to 182% a year before costs lost 64 to 99% after a cost of 10 bp per trade[53].
Such an edge belongs to whoever trades most cheaply, which means market makers, not someone paying taker fees through an API.
Language models are good research assistants, programmers and readers of documents. As autonomous traders they have not shown skill in any test long and clean enough to tell, they remember the history they are tested on, and an agent with keys is a security problem before it is a trading strategy.
For an ML engineer moving into this field, the habits that matter are the ones markets punish for skipping: splitting by time with a gap, putting costs into the evaluation and not after it, counting how many variants were tried, thinking of a Sharpe ratio as an estimate with a standard error, and testing language models only on dates after their training.
For a trader, the same habits turn into questions to ask about any AI product. How many strategies were tried before this one was shown? How long is the live record, and does it include fees?
Were the backtest dates after the model’s training cutoff? Who holds the keys, and can they withdraw? And an offer of a fixed monthly return is not a trading product at all.
There is also a question for the market as a whole. Central banks have started to worry that many traders using the same few models will act alike; the Bank of England warned that more advanced AI trading strategies “could lead to firms taking increasingly correlated positions and acting in a similar way during a stress”[54].
In Alpha Arena, four of the six models, given the same prompt, moved together with hourly correlations between 0.52 and 0.83.
In a market where many agents read the same news with the same model, a crowded trade can form in minutes, and the hour that unwinds it is the kind that sits in the tails of the first chart of this post.
References
- Nof1 (2025). Exploring the limits of large language models as quant traders. Blog post, archived copy. ↩
- Azhang, J. (2025). Season 1 of Alpha Arena has officially ended. Post on X, 3 November 2025. ↩
- MEXC (2026). MEXC AI trading report: 85% use AI for crypto, yet only 6.5% would authorize it to trade most of their funds. Press release. ↩
- U.S. Securities and Exchange Commission (2026). SEC charges multiple entities in fraud schemes totaling at least $15 million that used WhatsApp and other platforms to lure investors. Press release 2026-95. ↩
- CoinDesk (2026). Binance uncovers wider breach in $6.3 billion exploit, targets Sunday withdrawal restart. 30 October 2026. ↩
- Corsi, F. (2009). A simple approximate long-memory model of realized volatility. Journal of Financial Econometrics, 7(2), 174–196. ↩
- Bailey, D. H., & López de Prado, M. (2014). The deflated Sharpe ratio: correcting for selection bias, backtest overfitting, and non-normality. Journal of Portfolio Management, 40(5), 94–107. ↩
- Harvey, C. R., Liu, Y., & Zhu, H. (2016). … and the cross-section of expected returns. Review of Financial Studies, 29(1), 5–68. ↩
- Lo, A. W. (2002). The statistics of Sharpe ratios. Financial Analysts Journal, 58(4), 36–52. ↩
- Fan, T., Yang, Y., Jiang, Y., Zhang, Y., Chen, Y., & Huang, C. (2025). AI-Trader: benchmarking autonomous agents in real-time financial markets. arXiv. ↩
- Chen, Y., et al. (2025). StockBench: can LLM agents trade stocks profitably in real-world markets?. arXiv. ↩
- Yu, H., Li, F., & You, J. (2025). LiveTradeBench: seeking real-world alpha with large language models. arXiv. ↩
- Barton, T. J., et al. (2026). What LLM trading agents actually do in production: a six-month, population-scale record from two fleets. arXiv. ↩
- Lopez-Lira, A., Tang, Y., & Zhu, M. (2025). The memorization problem: can we trust LLMs’ economic forecasts?. arXiv. ↩
- Li, X., Zeng, Y., Xing, X., Xu, J., & Xu, X. (2025). Profit Mirage: revisiting information leakage in LLM-based financial agents. arXiv. ↩
- Li, W. W., Kim, H., Cucuringu, M., & Ma, T. (2026). Can LLM-based financial investing strategies outperform the market in long run?. KDD 2026, Datasets and Benchmarks Track. ↩
- He, S., Lv, L., Manela, A., & Wu, J. (2025). Chronologically consistent large language models. arXiv. ↩
- Man Group (2025). What AI can (and can’t yet) do for alpha. Man Group insights. ↩
- Cointelegraph (2026). Over 95% of Coinbase’s code is written with AI: Rob Witoff. ↩
- Anthropic (2025). AI agents find smart contract exploits. Research post. ↩
- Fiszeder, P., Orzeszko, W., & Pietrzyk, R. (2026). News sentiment analysis using ChatGPT for Bitcoin price dynamics. Journal of Big Data, 13, 106. ↩
- Wintermute (2026). Machine learning researcher. Job advertisement on Built In. ↩
- Forecasting Research Institute (2026). AI models have likely reached parity with superforecasters on ForecastBench. 16 July 2026. ↩
- Saguillo, O., Ghafouri, V., Kiffer, L., & Suarez-Tangil, G. (2025). Unravelling the probabilistic forest: arbitrage in prediction markets. AFT 2025. ↩
- Shi, Y., Fu, Z., Chen, S., Zhao, B., Xu, W., Zhang, C., & Li, J. (2026). Kronos: a foundation model for the language of financial markets. AAAI 2026. ↩
- Ansari, A. F., et al. (2025). Chronos-2: from univariate to universal forecasting. arXiv. ↩
- Rahimikia, E., Ni, H., & Wang, W. (2025). Re(visiting) time series foundation models in finance. arXiv. ↩
- Brini, A. (2026). Forecasting realized volatility with time series foundation models: a comparison with econometric benchmarks. arXiv. ↩
- DL News (2024). Marc Andreessen distances himself from obscene memecoin GOAT after $300m surge. ↩
- CoinGecko (2025). AI agent market map: hype ends, technology continues. With Tiger Research. ↩
- CoinDesk (2026). AI agent token once worth $2.4 billion ends with founder calling it dead. 5 August 2026. ↩
- The Block (2024). Human player outwits Freysa AI agent in $47,000 crypto challenge. ↩
- The Block (2025). AI crypto bot AIXBT lost $100,000 worth of ETH after hacker gained unauthorized “dashboard access”. 18 March 2025. ↩
- CryptoSlate (2026). Grok’s crypto wallet was just exploited by a tweet sent in morse code without any private key compromise. ↩
- Patlan, A. S., Sheng, P., Hebbar, S. A., Mittal, P., & Viswanath, P. (2025). Real AI agents with fake memories: fatal context manipulation attacks on Web3 agents. arXiv. ↩
- PolySwarm (2026). The ClawHavoc campaign. ↩
- Knostic (2026). When “auto-signing” sends your wallet: a malicious MCP server on npm. ↩
- Liu, H., Shou, C., Wen, H., Chen, Y., Fang, R. J., & Feng, Y. (2026). Your agent is mine: measuring malicious intermediary attacks on the LLM supply chain. arXiv. ↩
- Rizvani, A., Apruzzese, G., & Laskov, P. (2026). Adversarial news and lost profits: manipulating headlines in LLM-driven algorithmic trading. IEEE SaTML 2026. ↩
- crypto.news (2026). Binance just gave AI bots a trading license. The safeguards are thinner than they look. ↩
- OKX (2026). Connecting agentic trading to OKX exchange with Agent Trade Kit. ↩
- Kraken (2026). Announcing the Kraken CLI. Kraken blog. ↩
- Commodity Futures Trading Commission (2024). Customer advisory: AI won’t turn trading bots into money machines. ↩
- Commodity Futures Trading Commission (2022). CFTC charges South African pool operator and CEO with $1.7 billion fraud involving bitcoin. Press release 8549-22. ↩
- U.S. Securities and Exchange Commission (2026). Complaint, SEC v. BG Wealth Sharing Ltd. and DSJ Exchange Pty Ltd.. U.S. District Court, Northern District of California, filed 29 October 2026. ↩
- FBI Internet Crime Complaint Center (2026). Internet crime report 2025. ↩
- Chainalysis (2026). 2026 crypto crime report: scams. ↩
- Financial Conduct Authority (2026). Young investors trust AI more than TV or celebrities. Press release. ↩
- Schmeling, M., Schrimpf, A., & Todorov, K. (2023). Crypto carry. BIS Working Papers, 1087. ↩
- CoinGlass (2026). CoinGlass 2025 crypto derivatives market annual report. ↩
- Chitra, T. (2025). Autodeleveraging: impossibilities and optimization. arXiv. ↩
- Jaquart, P., Dann, D., & Weinhardt, C. (2021). Short-term bitcoin market prediction via machine learning. Journal of Finance and Data Science, 7, 45–66. ↩
- Bysik, A., & Ślepaczuk, R. (2026). Machine learning-based bitcoin trading under transaction costs: evidence from walk-forward forecasting. arXiv. ↩
- Bank of England (2025). Financial stability in focus: artificial intelligence in the financial system. ↩